If you're looking for a detailed Chart Patterns cheat sheet, you've come to the right place!
It doesn't matter if you're a beginner or an experienced trader; if you're serious about becoming a professional trader, you'll need the right tools.
And there's no better tool to help you spot profitable chart patterns than a simple cheat sheet.
The problem is, most people don't know how to trade price action correctly - They confuse the patterns, or they pick the wrong ones to trade.
So they end up losing money and quit trading altogether. I don't want that to happen to you.
That's why I and my team here at Wealthy Education have created this comprehensive chart pattern cheat sheet for you.
It can be incredibly helpful to traders like yourself - Especially if you're looking to get an edge in the market.
Now let's jump right in.
Understanding Chart Trading Patterns
Understanding chart patterns is essential when you're trading financial markets as they can help you spot trends early and anticipate future price movements.
In other words, they can help you identify potential turning points in the market, and allow you to time your trades more accurately.
When you understand clearly how chart patterns work, you can react quickly to market changes and protect your account from unnecessary losses.
The better you understand them, the more successful you will be at identifying good entry and exit points for your trades.
And that's the aim of the game.
What Are Chart Patterns?
A chart pattern is a recognizable formation on a price chart that appears as a recurring sequence of events and price action.
In a nutshell, a chart pattern is simply the way prices behave over time. It shows us what the market has done in the past and what it's likely to do in the future.
Chart patterns are characterized by a series of past price movements that repeat themselves over time across various markets and timeframes.
These charting patterns are created by human emotions and they change according to market behavior.
That's why you often see the same pattern over and over again across different markets - because human nature is the same everywhere.
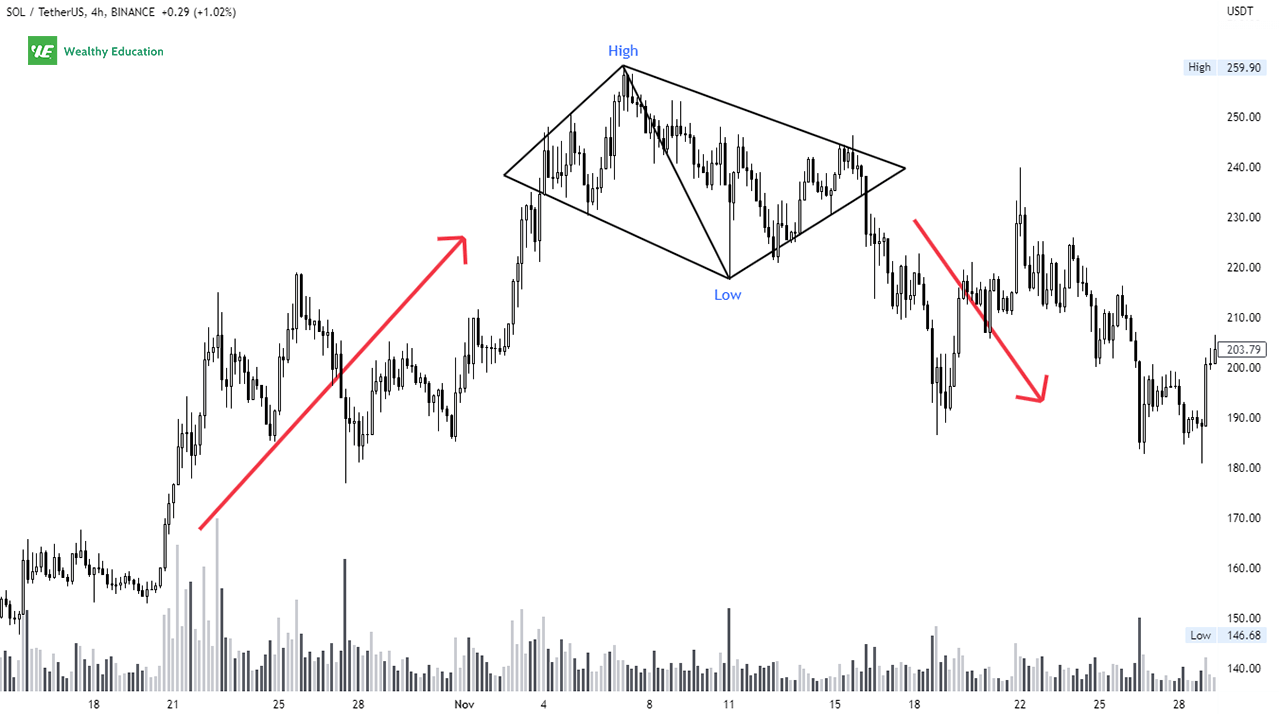
There are 3 major types of chart patterns, and each one has its characteristics and variations:
- Reversal patterns
- Continuation patterns
- Bilateral patterns
These patterns are further divided into different categories based on the trader sentiment at the time they are formed: bullish, bearish, or neutral.
They represent a shift in momentum and changes in trend direction, thereby giving you an indication of where the price is going next.
Does Chart Pattern Trading Work?
The answer is yes if you know how to read chart patterns correctly and how to use them to your advantage.
When used properly, they can increase your winning rate and help you become a profitable trader in the long run.
However, all chart patterns are based primarily on historical price data, and hence they're not always 100% accurate.
Keep in mind that they only give you a prediction of the future, not a guarantee of what will happen next.
You will also find a lot of repeating patterns when analyzing charts, but not all of them are reliable or profitable to trade with.
Therefore, you should focus on the most reliable chart patterns that suit your trading style and risk appetite.
How to Learn Chart Patterns
Chart patterns are one of the building blocks of technical analysis, and learning how to identify them can have a huge impact on your trading success.
FYI, technical analysis is a method of analyzing past price movements to anticipate future price movements.
Some technical chart patterns can signal reversals; others provide signals for trend continuations.
The key to success is learning how to spot these chart formation patterns and using them in logical ways to forecast future price action.
The more you can recognize and interpret them, the better your chances are of spotting profitable opportunities in the market.
If you're looking to become a professional chart pattern trader, you can check out our chart pattern trading courses here at Wealthy Education.
You'll learn how to spot the most profitable chart patterns and reliable trade setups to build a solid trading strategy that works for you in any market and timeframe.
Types of Chart Patterns
A pattern is a series of similar price actions that occur over time and eventually form a distinct shape on the charts.
Chart patterns are based on technical analysis and the study of past market data. They're based on the assumption that history keeps repeating itself.
Technical analysis doesn't predict the future, but it does provide valuable insights into how prices behave and what factors drive the market's direction over time.
By studying the formation and breakdown of different charts in the past, you can gain a better understanding of what is likely to happen again in the future.
As I mentioned earlier, there are 3 types of chart patterns in technical analysis: reversal, continuation, and bilateral.
Now let's take a look at each of them in more detail.
Reversal
A reversal pattern occurs after a prolonged downtrend or uptrend, and it signals that the price may reverse and start moving in the opposite direction.
It tells you exactly when the market is about to reverse course and shows you the direction of the upcoming trend.
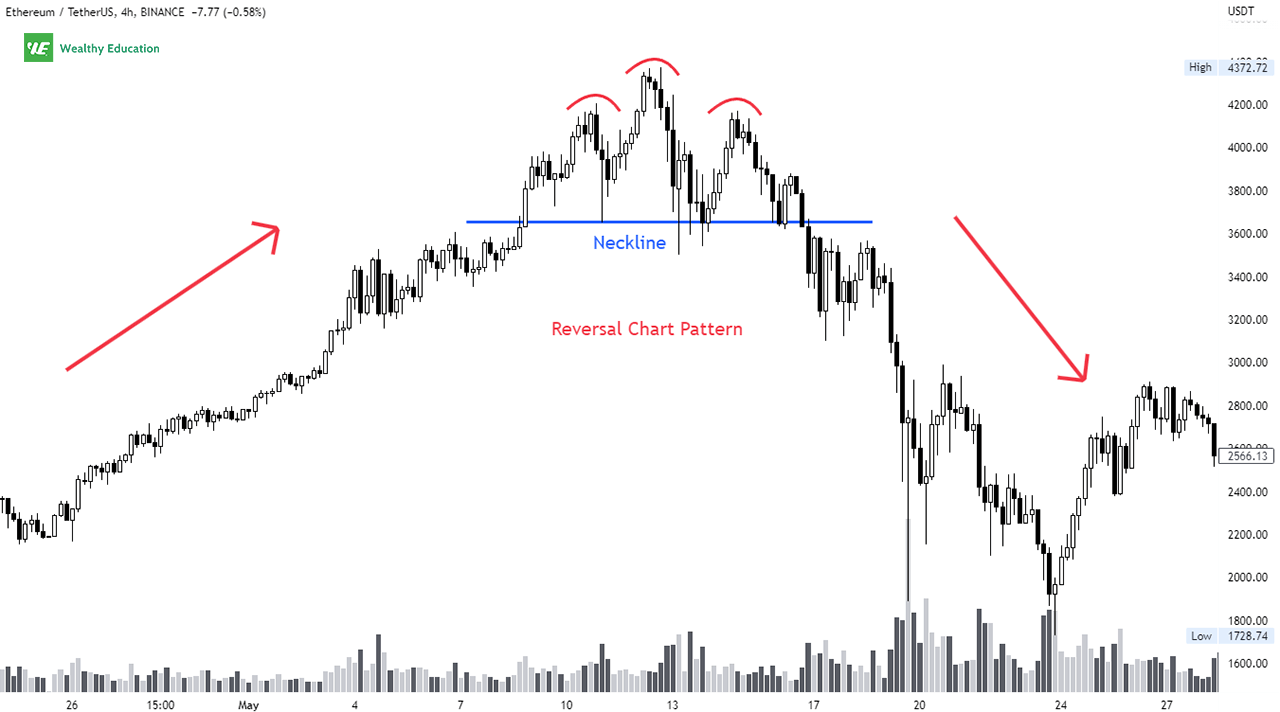
For example, if a prevailing trend is upward and you find a reversal chart pattern, you can assume the trend is likely to reverse to the downside soon.
And vice versa, if you find a reversal formation near the market bottom, you can expect the price to start moving up shortly.
These chart reversal patterns can appear in both bull and bear markets. However, they often signal the end of an existing trend and the beginning of a new cycle.
By identifying these reversal signals early, you can position yourself accordingly and capture more profits along the way.
Continuation
A continuation pattern appears in the middle of a trend, and it indicates that prices are likely to continue moving in the same direction as the ongoing trend.
This pattern forms when the market shows signs of slowing down, but the underlying momentum is still strong enough to keep prices from reversing direction.
It implies that traders are taking a break from selling or buying at the current price levels, but they still expect the trend to continue in the same direction.
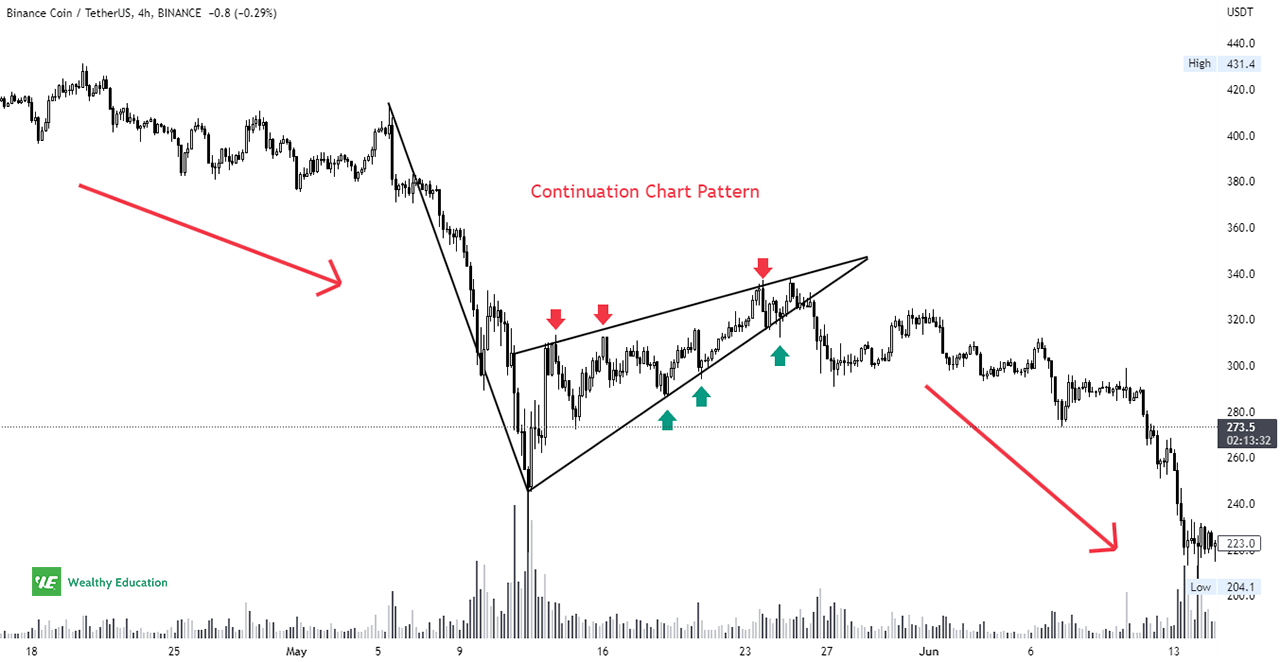
For example, when you see a continuation chart pattern forming in an uptrend, you can anticipate that the existing uptrend will continue for a while.
In this case, the price will continue to move higher as long as buyers are still in control and the bullish momentum remains strong.
By identifying these continuation formations early, you can time your trades perfectly and take advantage of the prevailing trend while it lasts.
Bilateral
A bilateral pattern is formed when the market is going sideways or consolidating in a narrow trading range without a clear direction.
This type of chart pattern indicates that prices can move in either direction depending on current market conditions and significant changes in trader sentiment.
It usually lasts for a while before the price action finally breaks out of the formation and starts trending again. Therefore, it can be both a continuation or reversal pattern.
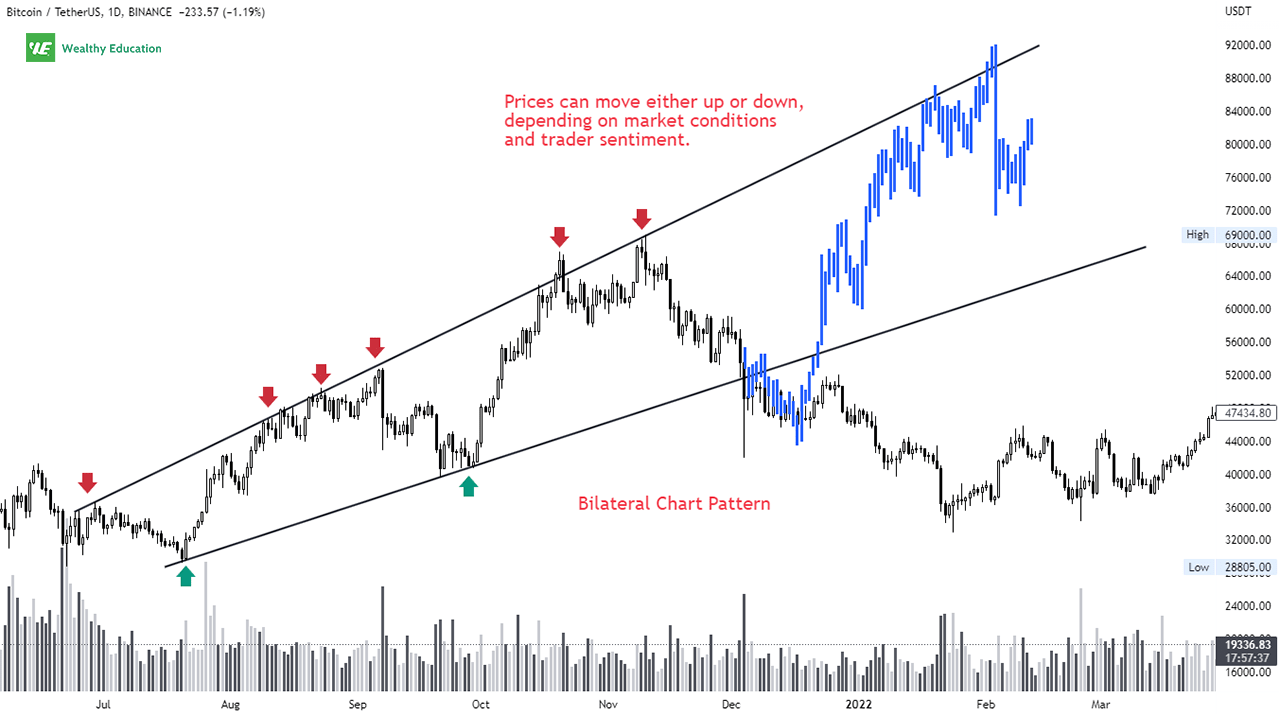
The pattern's breakout confirms that the consolidation period is over and the market is ready to resume its movement in the direction of the breakout.
By identifying these bilateral chart patterns early, you can either stand on the sidelines or spot trading opportunities on both sides of the market.
Chart Pattern Cheat Sheet
A printable Chart Patterns cheat sheet is a quick reference guide that helps you remember all popular chart patterns that you can use for your chart analysis.
If you're serious about trading, you need a guide that can help you identify different chart patterns with ease.
And that's exactly what this cheat sheet gives you.
Feel free to print it and keep it handy for quick and easy reference whenever you're in the trading mood.
And don't be afraid to refer back to it often to refresh your memory on these important formations and their meanings.
Before moving on, here are some quick notes:
- We have rated all chart patterns based on factors such as their reliability, profitability, ease of identification, and how they fit the current market environment.
- We have done multiple performance tests on different timeframes to ensure that our ratings are as accurate as possible.
- We don't give much credit to neutral (or bilateral) patterns because they are less reliable in nature.
- We don't give much credit to extremely rare (or complex) patterns because they are less useful and hard to find on charts.
Now let's dive into our review of the top bullish and bearish chart patterns.
Bullish Chart Patterns
A bullish chart pattern indicates an upward trend in price action after a breakout from the formation.
These setups suggest that sellers are losing control of the market, and buyers are now taking over and driving prices higher.
If you're looking for opportunities to make a profit on the long side, below are some technical analysis chart patterns you want to catch early.
Bullish Formation | Type | Location | Rating |
|---|---|---|---|
Reversal | Downtrend | ||
Double Bottom | Reversal | Downtrend | |
Cup and Handle | Reversal | Downtrend | |
Continuation | Uptrend | ||
Reversal | Downtrend | ||
Reversal | Downtrend | ||
Reversal | Downtrend | ||
Reversal | Downtrend | ||
Continuation | Uptrend |
Bearish Chart Patterns
A bearish chart pattern indicates a potential decrease in price after a breakout from the formation.
These setups suggest that sellers are gaining control of the market and pushing prices lower. A sell-off may happen if they form during a bear market.
If you're looking to trade on the short side, below are some breakout chart patterns you want to spot as early as possible.
Bearish Formation | Type | Location | Rating |
|---|---|---|---|
Head and Shoulders | Reversal | Uptrend | |
Reversal | Uptrend | ||
Continuation | Downtrend | ||
Reversal | Uptrend | ||
Reversal | Uptrend | ||
Reversal | Uptrend | ||
Reversal | Uptrend | ||
Reversal | Uptrend | ||
Reversal | Uptrend | ||
Continuation | Downtrend |
Neutral Chart Patterns
A neutral chart pattern indicates indecision between buyers and sellers in the market before a breakout from the formation.
A breakout can occur in either direction, depending on the strength of the current trend, supply and demand, and investor sentiment.
Because of this uncertainty, a neutral pattern requires careful observation and a lot of patience until a breakout happens, which signals the end of the sideway period.
If you find these advanced chart patterns, you'll want to watch the market closely until the price moves in a particular direction to confirm your analysis.
Neutral Formation | Type | Location | Rating |
|---|---|---|---|
Bilateral | Downtrend | ||
Ascending Triangle | Bilateral | Mid-trend | |
Bilateral | Mid-trend | ||
Descending Triangle | Bilateral | Mid-trend | |
Symmetrical Triangle | Bilateral | Mid-trend | |
Bilateral | Uptrend |
Understanding Trading Psychology
Trading is a psychological game and you must realize that. It's all about the human psychology behind the pattern and how it affects trader behavior.
For example, let's say you spot a bullish flag pattern forming on your chart. You immediately start buying, but the price never moves in your favor.
If you panic and give up, you'll lose a lot of money. But if you stay calm and wait for the breakout to occur, you'll quickly make a nice profit.
That's how trading psychology comes into play. It's your responsibility to understand how and why the patterns form so that you can capitalize on them at the right time.
A lot of people think that trading is a mathematical game where if you apply the right math you can succeed and become a millionaire.
But it's much more than that. It's psychology, discipline, and risk management all bundled into one.
If you want to become a profitable trader, you'll need to learn how to control your emotions and manage your psychology properly when things don't go your way.
Here's the truth: 90% of traders never become profitable because they don't know how to control their psychology.
It's a lot easier to get over a big loss than a small one. When you have a small loss, you frequently feel that you just have to get back in the trade.
But when you have a major loss, your natural inclination is to quit trading and do something else with your life.
In other words, you'll end up being a loser because you can't handle the psychological pressure. You quit too early before you get back your losses.
Successful traders have a completely different mindset - they stay in the game no matter what.
They take losses and they understand that it's part of the game and they have to live with it to win big in the future.
Trust me - if you learn how to control your emotions, your trading will skyrocket!
Understanding Risk Management
Risk management is the single most important thing in trading. Period.
I know what it's like to try trading the market without the right risk management strategies in place, and it's a terrible experience.
If you can manage risk properly and limit your losses, you'll be ready to ride your winning trades to the finish line.
But if your risk management is sloppy and you don't manage your position size correctly, you could blow up your account in the blink of an eye.
Many traders think risk management is just about "do not lose money" - But that's not true at all.
It's about having a plan ahead of time for what to do if things go south (and they will) so that you don't panic and blow your account in the process.
It's about knowing when to cut losses quickly and run when things get ugly in the market so you don't get wiped out completely.
It's about learning how to calculate your position size and risk tolerance level so you can set the proper stop loss for every trade you take.
It's about setting your profit target and exit strategy in advance so that you can achieve a good risk-to-reward ratio.
And a lot more...
If your risk management sucks, you'll never be able to make money, and you'll keep losing over and over again.
You'll eventually get frustrated and start blaming others for your mistakes - that's the last thing you want to do as a trader.
So make sure that you master the art of risk management before you do anything else in your trading career.
More Useful Tips
Trading can be very rewarding, but it can also be very risky if you don't know what you're doing.
With the market constantly changing, it's critical that you learn to adjust your trading strategy when necessary.
Sometimes, you may have to change your strategy on the fly to adapt to market conditions.
But if you're smart about it, you'll be able to spot the signals and use them to your advantage when the market gives you the green light to trade.
That's the key to making money consistently as a trader. If you do it right, you can make yourself a lot of money over time.
How to Draw Chart Patterns in TradingView
As a price action trader, you need to be able to draw chart patterns to effectively trade the market and identify profitable opportunities.
I personally use TradingView for all of my charting needs because I find it to be the most powerful charting platform, and it's completely free!
If you're not familiar with it, it's a web-based charting tool that allows you to view charts, build custom indicators, and analyze price action.
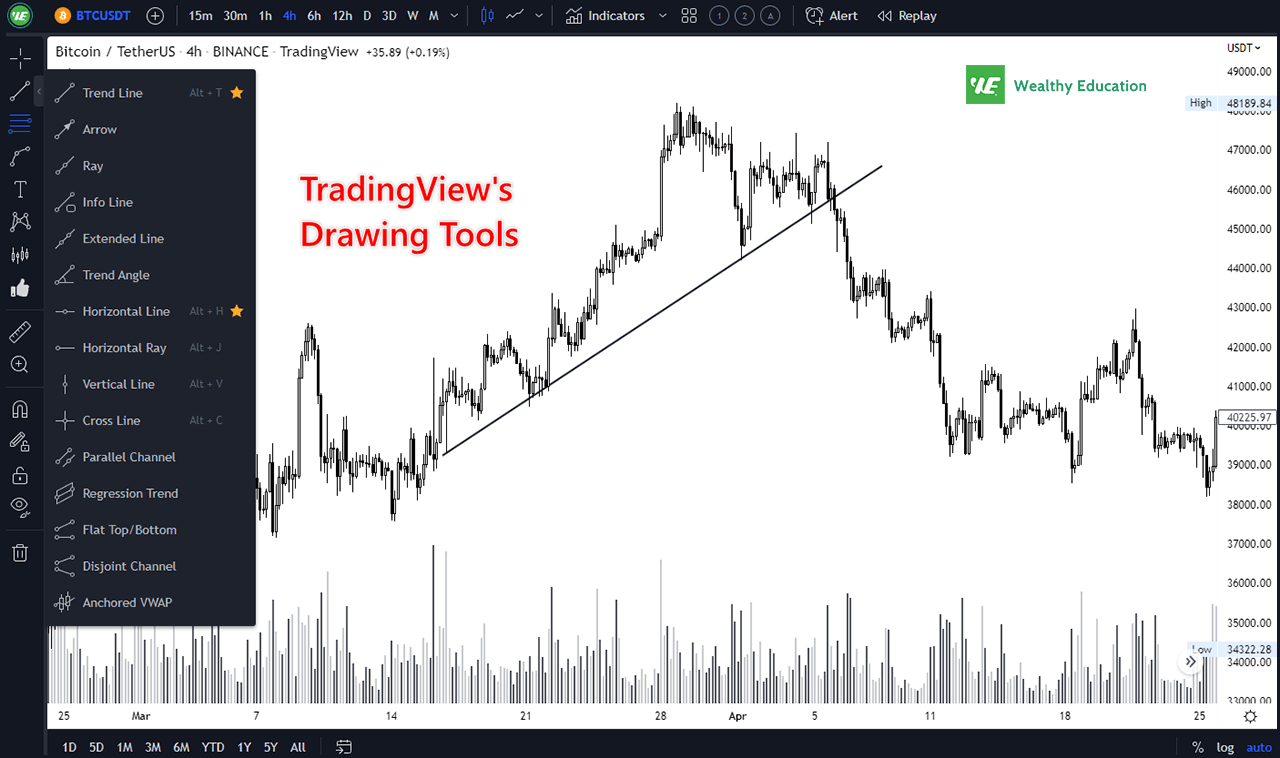
Drawing basic chart patterns is extremely easy on TradingView because everything is drag-and-drop and can be customized to your preference.
You can draw trend lines, moving averages, Fibonacci retracements, support and resistance levels, and more with just a few clicks of the mouse.
It's also very intuitive to use and allows you to move back and forth between different time frames with ease.
You can read my detailed guide on How to Use TradingView for Professional Trading here to learn how to plot and draw your favorite technical analysis tools.
How to Use a Chart Pattern Screener
Using a chart pattern scanner can dramatically improve your trading results, and it's easier than you think.
But trading isn't just about finding the right patterns. You also need to be on the right side of the price at the exact moment the pattern forms.
That's where a chart pattern screener comes in handy.
It's basically a tool that scans the entire market for bullish or bearish signals and alerts you when there's a potential trade setup that matches your criteria.
All you have to do is wait for the signal and then place the trade when you find the right setup. It's as simple as that.
I personally use the Finviz stock screener because it offers advanced filtering capabilities that allow me to zero in on the most profitable setups in seconds.
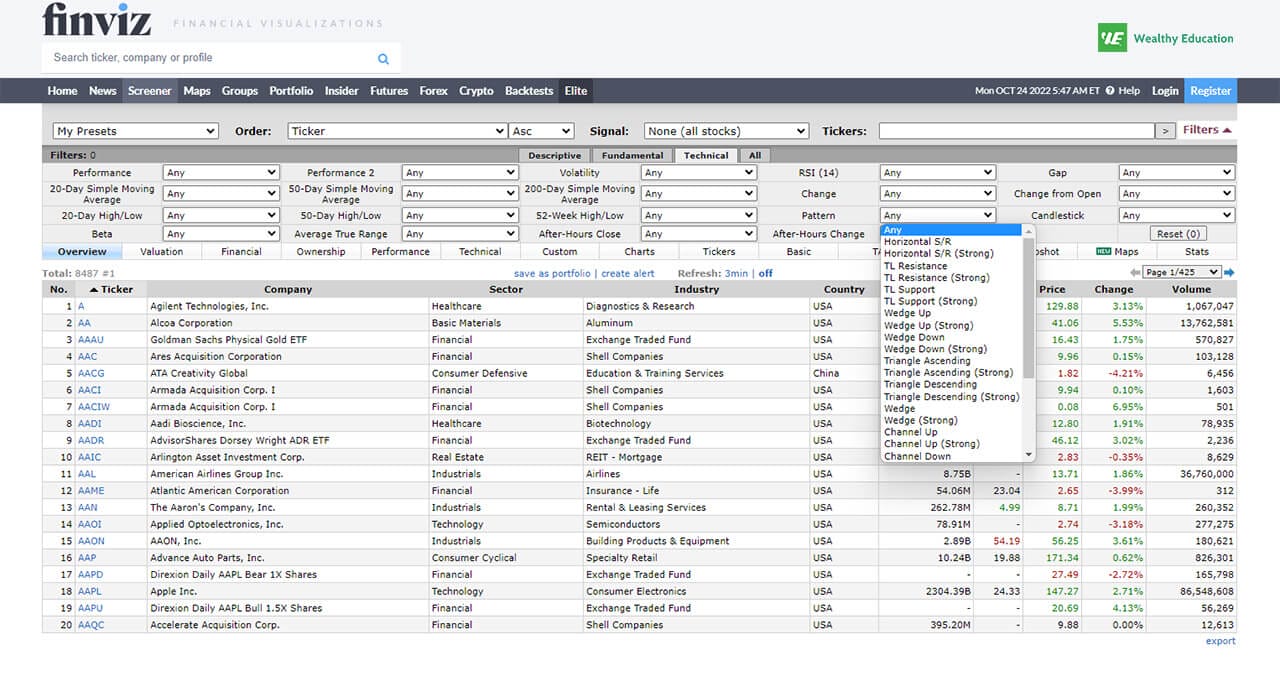
I can also search for stocks based on the most common chart patterns and technical indicators such as moving averages, candlesticks, Relative Strength Index (RSI), and more.
This means I can find stocks that are breaking out based on any chart pattern indicator I want, like inverted head and shoulders or double top formations.
So if you're looking for an easy way to find and trade the most successful chart patterns, I definitely recommend that you give it a try.
What Is the Best Time Frame for Chart Patterns?
The answer to this question depends on how you trade. Chart patterns can be profitable in any timeframe.
However, some patterns perform better on longer timeframes (i.e daily and weekly charts) while others are better on shorter ones.
In my experience, the more complex a pattern is, the more time it requires to form and complete.
This means the shorter the timeframe you use, the more false signals you'll get, and obviously the more risk you'll take.
That's why you'll want to focus on higher timeframes if you're just starting out with technical analysis.
Keep in mind that the best time to trade stock market chart patterns is when they are developing and close to completing their formation.
This is the time when the price action is moving in a predictable direction, and you can easily identify buy and sell setups.
Also, if you wait too long to enter the market, the chart pattern might break or reverse, and you'll miss out on all the action.
In fact, most traders and investors never learn this lesson, and they end up getting burned over and over again.
So make sure that you don't make the same mistake.
Final Words
The best chart patterns allow you to see the market's underlying psychology, thereby you can identify high-probability trade setups.
All you need to do now is to learn which patterns are good to trade and which patterns you should stay away from.
Once you understand how the market works, you can replicate those patterns over and over again. It's sort of like trading with a built-in edge.
But without the right training, it can be very difficult to identify these patterns on your own - Especially when you're just starting out.
You need to know how to read price action, how to spot them in real time, and how to trade them.
It's an ongoing learning process that takes years to master. But once you do, you can profit handsomely from it for the rest of your life.
In addition, emotions are your biggest enemy when it comes to trading.
They will make you doubt yourself, second guess your decisions and cause you to lose thousands of dollars.
Mastering your emotions is the difference between success and failure in the market.
The best way to do this is by developing a disciplined mindset and applying sound money management principles to your trades.
This will help you overcome your fear and emotional weakness - And allow you to become a successful trader in the long run.
Finally, don't forget to refer back to our stock chart patterns cheat sheet whenever you're stuck in a tough situation with your trades.
It will help you save a lot of time - And money as well. Good luck and I'll see you next time.

