The diamond top pattern can be very profitable, but it requires a lot of knowledge and experience.
As a day trader, you're looking to make money off of this chart pattern, and you don't want to get stopped out or "hooked" on a loser.
While this pattern does pay well at times, it can also fail quite often if you're not careful. I know what it feels like to be stuck holding a huge losing position overnight.
However, if you understand how and when it forms, you can use it to your advantage to trade more consistently with better results.
And that's why I took the time to make this comprehensive guide for you to learn the exact way to identify and trade the bearish diamond formation.
Now let's jump right to the juicy stuff!
What Is a Diamond Top Pattern?
A diamond top pattern is a technical analysis pattern that is preceded by a strong uptrend.
It creates a series of higher highs and lower lows, and then lower highs and higher lows on a price chart.
By drawing trendlines connecting these minor highs and minor lows, you get a diamond shape on the chart and that's why this pattern becomes known as a "diamond top".
The formation is complete when the price action breaks below the lower trendline, or when the stock price closes outside the diamond pattern.
Volume plays an important part in development as well. It must be rising strongly during the bullish move that precedes the formation, and then declining sharply until the breakdown occurs.
This indicates that buyers have run out of steam and sellers are stepping in to take over the market momentum. As a result, prices fall hard once the selling pressure is unleashed.
Volume then surges and remains high during the downward breakout for several days.
This further confirms the strength of the move and makes it more likely that the decline will continue.
Formation
The diamond top formation can easily be confused with a head and shoulders pattern because they both involve a series of lows and highs that create a "head" and two "shoulders".
These patterns look identical and share the same characteristics (strong rally followed by a breakdown). So, how do you tell them apart?
The difference is where the breakout point occurs. In a head and shoulders formation, the breakout occurs when prices break below the neckline.
However, in a diamond top reversal pattern, the breakout occurs when the price moves outside the boundaries of the "diamond" itself.
If you don't understand this difference, you'll end up shorting the market prematurely. Trust me, this is an expensive mistake that can burn your account.
As mentioned early, the diamond top trading pattern is formed after a strong bullish move.
It's followed by a period of sideways consolidation where the bulls and the bears are battling it out for control of the market.
If you notice, this chart pattern is initially created by a broadening top formation (or an ascending broadening wedge) where the price action consolidates between the two diverging trendlines that create a trading range.
You can see diminishing volume and narrowing trading ranges during this period of indecision.
This indicates that buyers are getting tired and sellers are becoming more aggressive as they try to push prices lower.
The bearish sentiment is confirmed when the final leg down begins, as selling pressure increases sharply each day.
The pattern is fully complete when prices close below the lower trendline or break out of the "diamond" entirely.
Bearish Diamond Pattern Example
This formation is called a "diamond top" because the peaks and troughs form the shape of a diamond at, or near market tops.
By drawing trendlines connecting the peaks and troughs of the diamond, you can see how the pattern develops over time.
Now let's look at this example, so you can see exactly how it's formed:

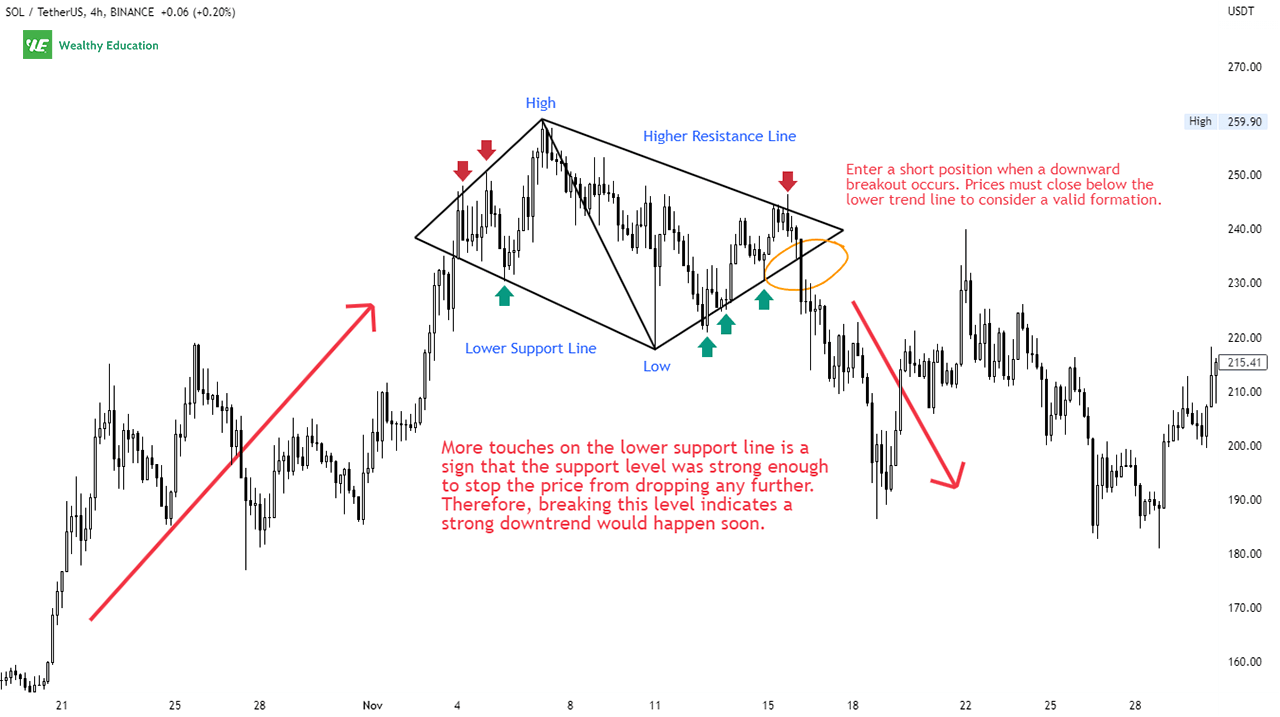
As you can see above, Solana (SOL/USDT) has been rallying since October.
The price then made a series of higher highs and lower lows until it reached the peak of around $260.
The trading range then became narrower and more volatile as technical traders became indecisive about which way the trend was moving.
More touches on the lower support line indicate that the support level was strong enough to stop the price from declining further, at least temporarily.
Therefore, breaking this level tells us that a strong downtrend would ensue soon.
The pattern was fully developed when prices broke out of the diamond chart pattern with a sharp drop to $186.42.
How to Trade a Diamond Top Chart Pattern
If you are wondering how to trade the diamond pattern, that's simple - follow its breakout direction.
That's to say, you can sell when the price breaks below the lower trendline, and buy when it breaks out above the upper trendline.
Now let's dive into each strategy in more detail, so you can understand clearly how it works.
Listen to The Bears
The first trading strategy involves shorting the market as soon as the price breaks down through the lower support trendline.
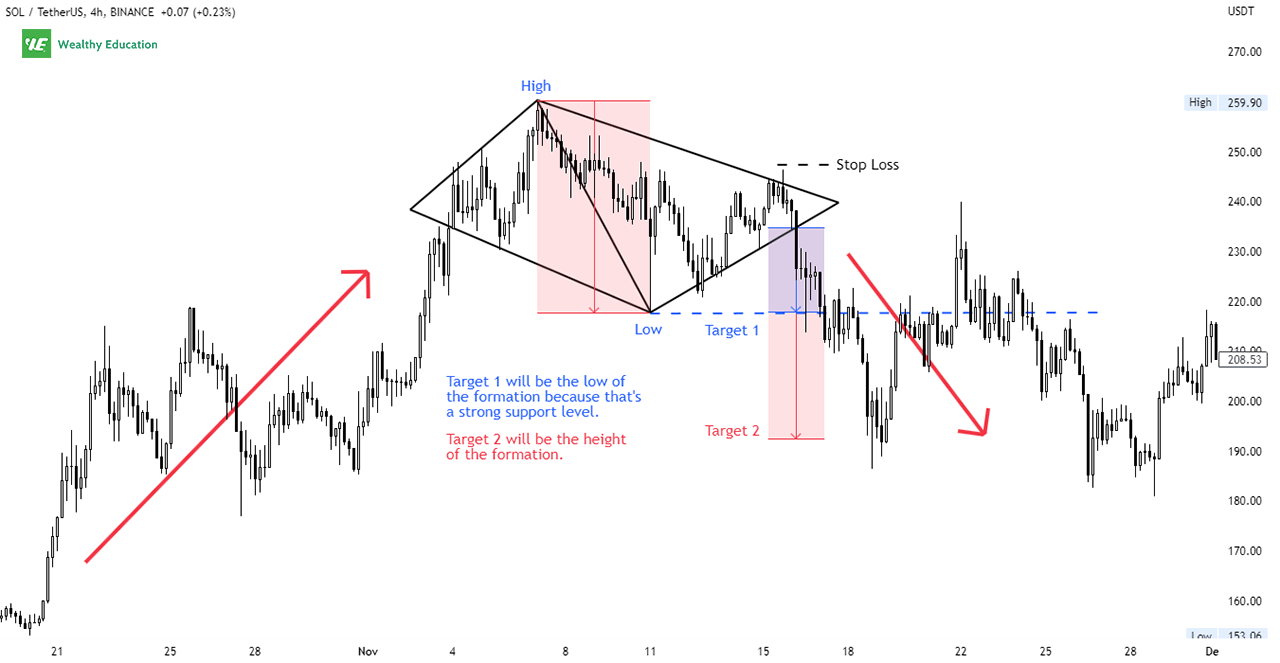
When diamond tops form, the first downside target is always the key support level (consider the lowest low).
The second target can be the distance between the highest and lowest point within the pattern.
Whatever is greater between the two targets is your best target price for the short trade.
Your stop loss is set just above the upper resistance line of the formation, depending on your risk tolerance and position size.

This strategy works exactly the same way as with any other trend reversal pattern, except that you need to be careful because this one is also prone to fakeouts.
Let me explain.
A false breakout or (a fakeout) is the term used to describe when the price breaks out of one side of the pattern and then reverses back towards the other side before breaking out again in either direction.
This happens because traders are still on the fence about the direction of the potential move, and they are trying to get out of the trades as quickly as possible.
So you need to be patient and wait for a confirmation before you enter a short trade.
Ride the Trend Up
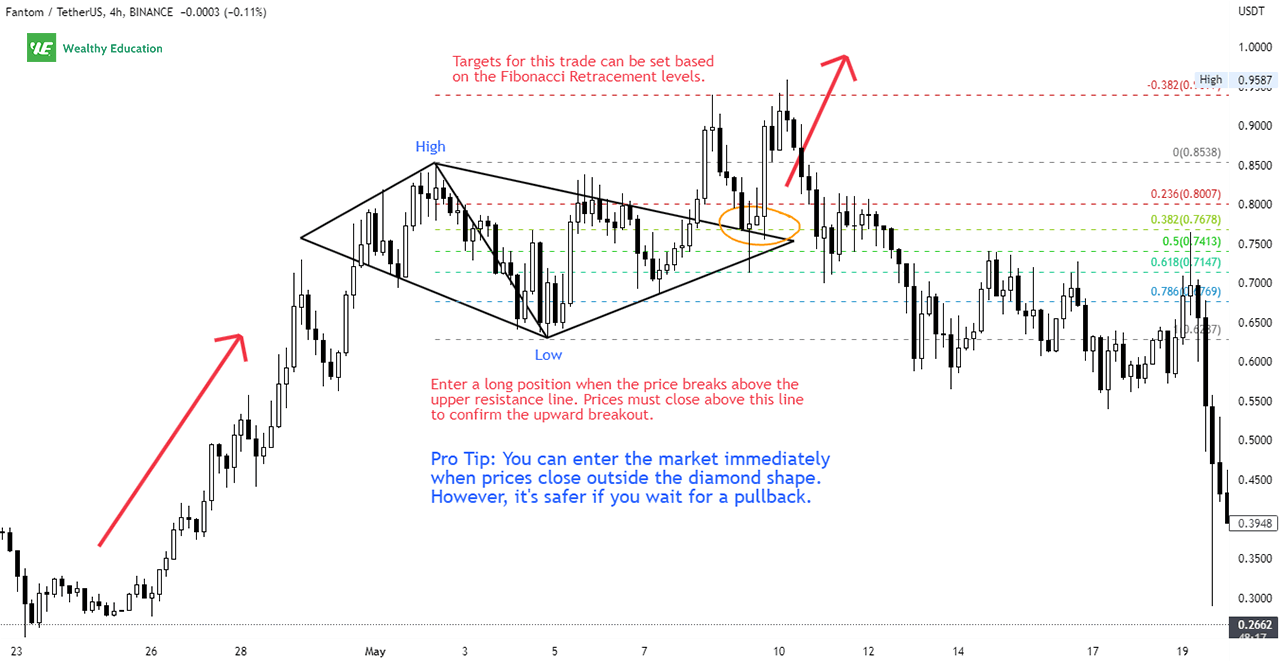
Even though this pattern is characterized as a bearish reversal formation, it also works as a bullish continuation if the price breaks above the upper trend line and continues higher.
To confirm the continued uptrend, you want to see that the price action makes higher highs and closes above the top trend line.

In this case, the best entry strategy is to buy above the resistance line with a stop loss just below the recent lows.
Potential targets for this trade can be set based on the Fibonacci Retracement levels.
A pullback may happen as traders want to re-test the broken trend line once again.
But as long as there is sufficient momentum to push the price higher, you will make money by riding the wave up.
Backtesting - Here's My Result
I have done many backtests using the diamond chart patterns on multiple timeframes and the success rates are more than satisfactory.
I have found that tall and narrow formations tend to perform much better than short and wide ones.
If you're betting on the downside breakout, you want to look for diamond patterns with more touches on the bottom trendlines.
This indicates that the support level is strong enough to withstand a lot of selling pressure.
Can you guess what will happen if this support level is broken?
When the price shoots past this support level, it shows a strong bearish conviction and confirms the strength of the downward move.
That's why I always pay extra attention to the lower trendlines when looking for a short trade setup.
If you master how to trade a diamond top chart pattern, you will have plenty of opportunities to profit from the market.
However, you must understand that even the best trading patterns in the world do not guarantee profits 100% of the time.
In fact, you should never expect to make money every single time you place a trade because that simply doesn't happen in the real world of trading.
Instead, you should focus on the probabilities of the trades based on market conditions and historical evidence.
You don't have to guess what will happen next in the market; just follow your own set of rules and let the market take care of the rest.
So I believe that if you follow this strategy with discipline and patience, you can make a lot of money in the long run.
Summary
A diamond top chart pattern can be a powerful short selling signal when it's confirmed with a strong break below the lower trend line.
The price may then reverse back up to test the broken support or resistance level, and resume the downtrend if the bulls fail to hold it up.
The bearish sentiment is confirmed by a sharp increase in volume during the decline. When the bears take control of the market, it's your time to go short.
This pattern also works as a bullish continuation pattern if an upward breakout occurs, and the price closes above the top trend line, confirming the continuation of the current uptrend.
As with other patterns like a diamond bottom or inverted cup and handle, you'll always want to wait for confirmation before entering your trade, especially with a volatile market like this one.

