Day trading an inverse cup and handle pattern can be very profitable if you know what you're doing.
Think of it this way - if you know exactly when to enter the market, you could earn 50% or more in a single year. That's the kind of returns you can achieve with this powerful chart pattern.
Imagine having a reliable strategy that tells you exactly which direction to follow every time the pattern develops.
Imagine being able to do that over and over again, year after year, even through the toughest market conditions.
Believe it or not, if you take the right steps, and use proper risk management techniques - you can turn your trading around!
In this article, you'll learn how to trade the inverted cup and handle step by step so that you can maximize your profits while minimizing your risks.
Now let's get started...
What is an Inverted Cup and Handle Pattern?
The inverted cup and handle pattern is a short-term bearish reversal pattern that appears in an upward price trend.
It is created when the stock price declines after reaching a peak, forms an upside-down cup shape, and then rallies back to near the previous high before declining again.
The pattern is considered valid when a downward breakout occurs and the price closes below the support or neckline.
This upside-down cup pattern works the same way as the cup and handle pattern, except that the breakout direction is downward instead of upward.
You can find this chart pattern more frequently on bear markets, and it works better on intraday timeframes.
Is an Inverted Cup and Handle Bullish or Bearish?
The inverted cup with handle is a bearish pattern. This pattern typically forms when the market swings up and bounces off the key support level.
The increased selling pressure pushes the price lower to retest the support level.
The downward breakout is confirmed when prices close below the support line that marks the bottom of the cup.
Continuation Pattern vs Reversal Pattern
A continuation chart pattern is formed within a current uptrend, downtrend or consolidation. It indicates that the current trend will continue in the same direction.
An ascending broadening wedge is a good example of a bearish continuation pattern as it forms as the market makes a series of higher highs and higher lows, followed by a breakout to the downside.
Conversely, a reversal is the opposite of a continuation. It usually occurs when the market reaches a top or bottom and begins to lose momentum.
A trend change happens when the price breaks through key support or resistance levels.
Examples of common reversal patterns in technical analysis include head and shoulders, double bottoms, and bump-and-run patterns.
So the next question is...
Is the inverted cup and handle pattern a reversal or continuation?
In my opinion, it can be both! That's because the price tends to continue its upward move at the beginning, and then reverses direction when bullish momentum declines.
Formation
The pattern is made up of two parts: an upside-down cup with a handle.
You can find this pattern on both uptrends and downtrends when the price climbs up steadily to reach a new high, and then falls back down to test the low of the initial move.
After the cup forms, the price attempts to rebound from the support trendline.
The handle is formed inside the trading range (on the right side of the cup) when prices fail to reach the previous high, and pull back down to re-test the support line once again.
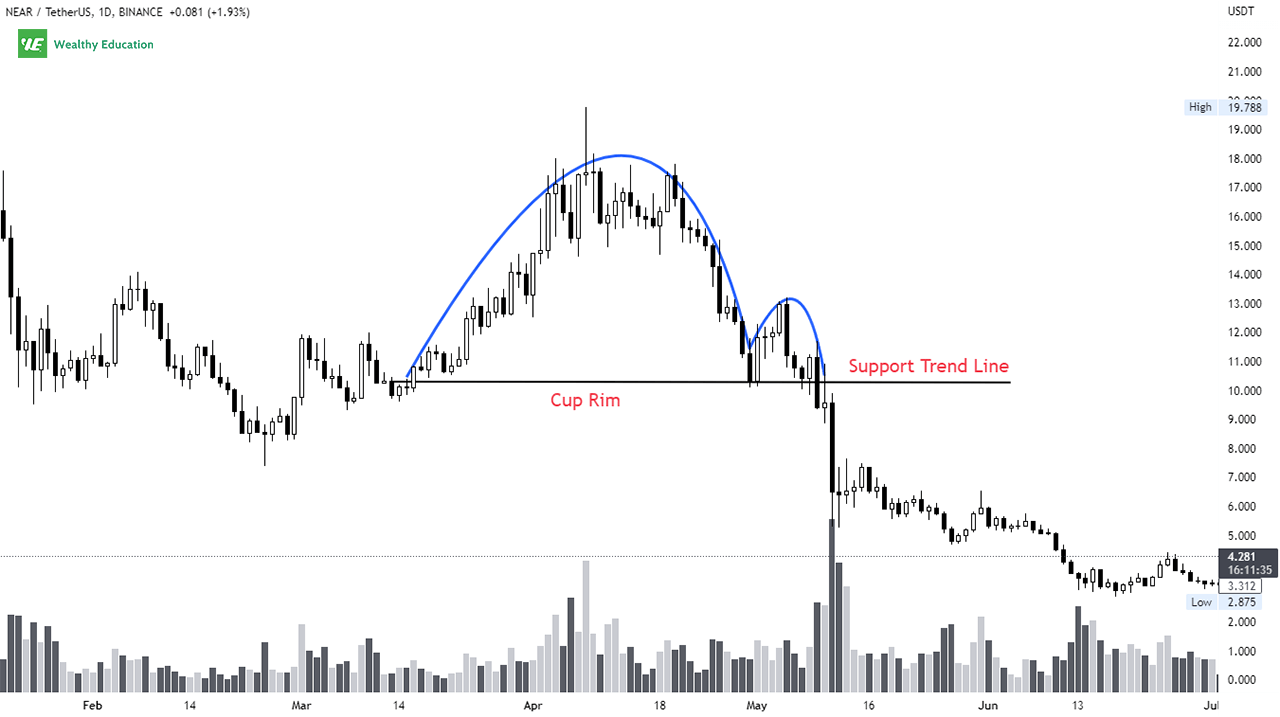
It's important to note that the size of the pattern really matters.
In my experience, narrow or tall patterns tend to perform better than wide or short ones.
They also have a shallow retracement on the handle (shorter than the lower half of the cup).
This indicates that the market's bullish sentiment is starting to fade, as the bulls are no longer strong enough to push the price up significantly.
The bears will soon take control and force the trend down for a correction or bear market.
The pattern is complete when the price breaks below the support line. This signals the end of the uptrend and the bears are coming.
You should keep in mind that this pattern can also act as a bullish continuation pattern that marks the beginning of a new uptrend.
This means that if the breakdown fails (prices bounce off the support trend line), there will be a strong buying pressure pushing prices back up again.
In this case, the prior trend will likely continue, and you can look for a buy setup.
Now let's have a look at a quick example, so you can know exactly what it looks like on a chart.
Example
The inverted cup and handle probability is rare. You won't see it quite often on weekly and daily charts, but you can spot it easily on shorter timeframes.
As you can see from the chart below, we have a reverse cup and handle pattern forming on ENJ/USDT for around 2 weeks from early February.
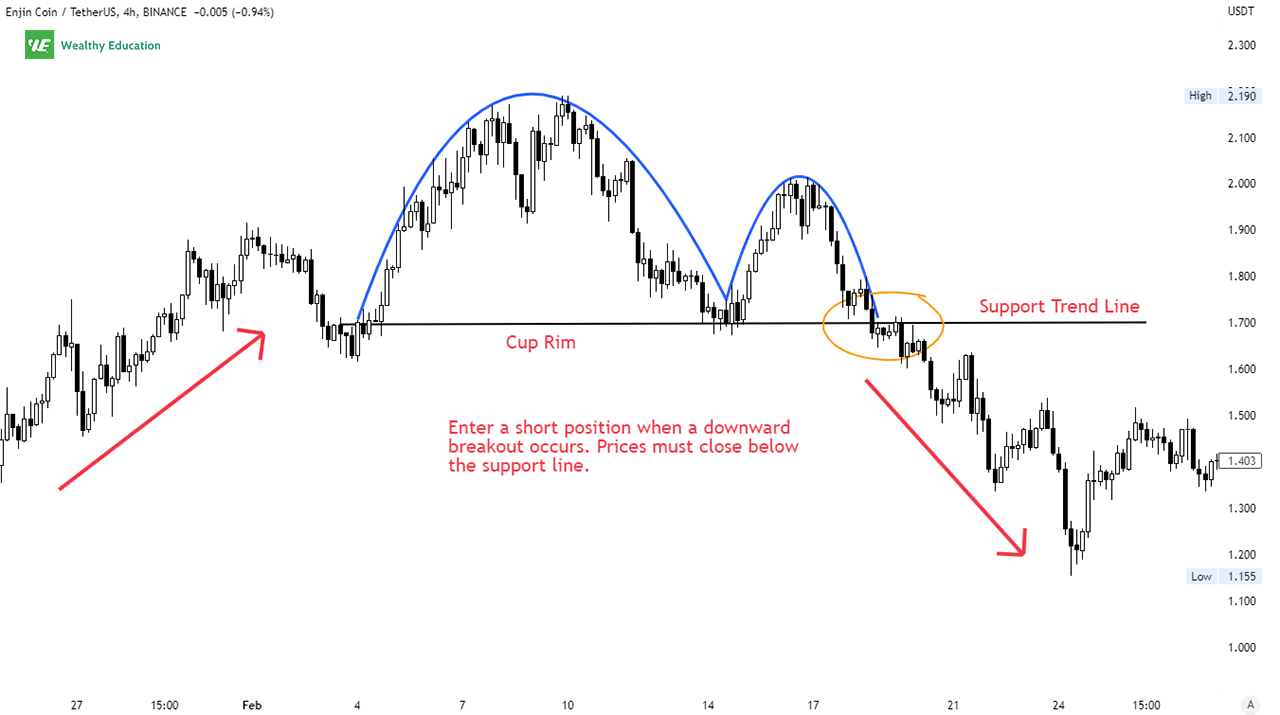
The horizontal line that connects the cup rim is known as the key support trend line in this chart pattern.
The breakout was confirmed when prices broke down from this level.
In this example, the breakout point was $1.705, and the price target will be the depth of the cup.
How to Trade the Inverse Cup and Handle
If you're trading the inverted cup and handle chart pattern, your best bet is on the downside.
But this doesn't mean that you will enter a short position immediately once you spot this chart pattern.
What you want to do is to wait for the pattern to fully form. That's when the support line is broken, and prices must close below this level.
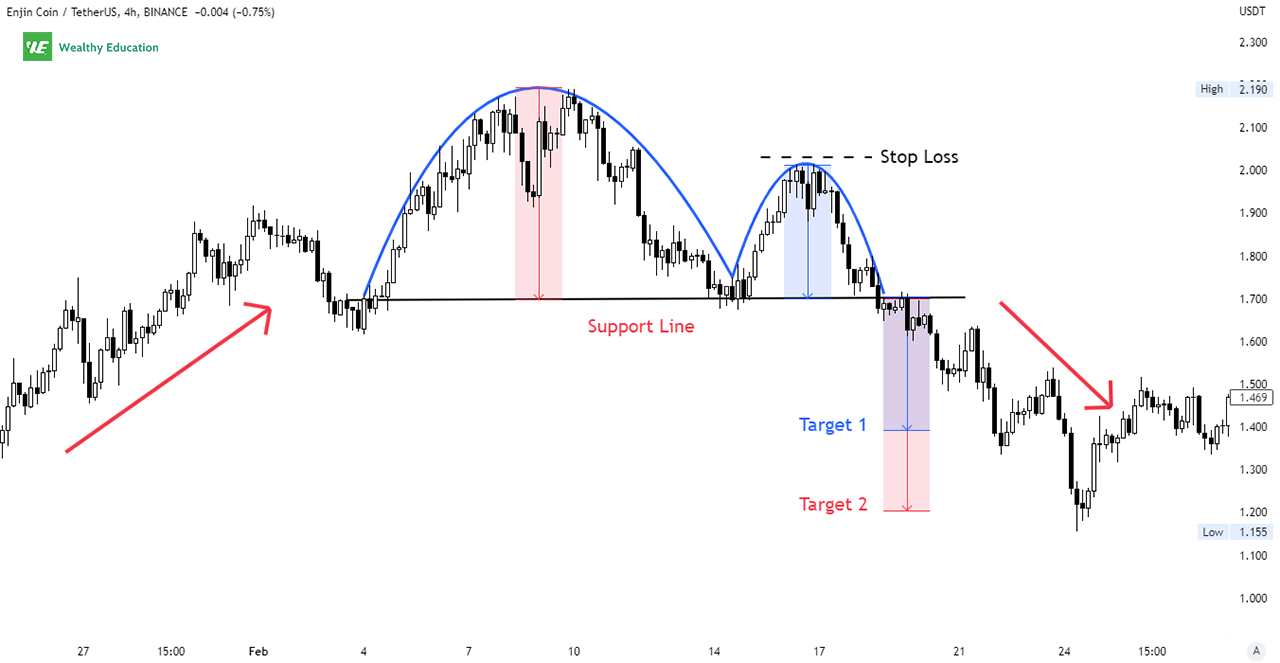
Remember, no chart pattern works 100% of the time.
So make sure you don't forget to place a stop-loss order above the top of the handle. This stop loss should be set based on your risk tolerance.
Your ideal profit target for this setup can be the same as the height of the cup part of the formation.
You can also use Fibonacci retracement levels to set potential targets for your trade.
Now let's dive into some powerful techniques...
Strategy #1 - Riding With The Trend
When it comes to riding the market, using a moving average is your best choice!
FYI, a moving average (MA) is a trend-following indicator that smooths out price movements, and shows you the average value of a security over a certain period of time.
The good thing is this indicator can help you quickly identify the direction of the current trend, and potential turning points.
And the great thing is... This technical indicator works flawlessly with the bearish cup and handle formation.
We'll use a 20-period exponential moving average (EMA-20). When you plot it on a chart, this EMA acts as a dynamic support and resistance level.
As you can see, the EMA moves along with the price.
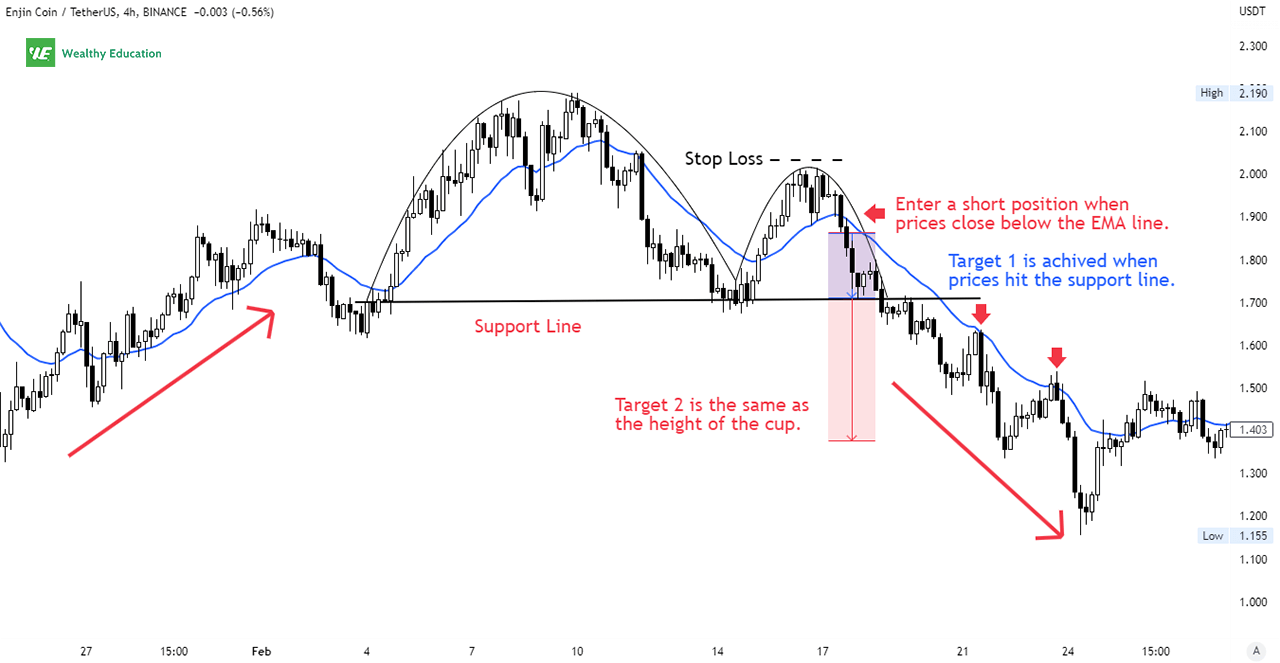
Here's a quick note...
If prices are trading above the EMA 20, it means that the prevailing trend is up. And vice versa, prices moving below this EMA line indicate that the market is going down.
So what's the strategy?
We'll consider going short once the price has closed below the EMA 20.
You can use candlestick formations to determine your entry point. You want to see a shooting star or an inverted hammer form right below the EMA line.
If the market moves in your favor, you can hold your position until there's a pullback towards the cup rim. We will then take a quick profit and get out immediately.
It's important to close your short position quickly, as you know the "handle" will form soon. The price tends to rebound when it hits the support trendline.
This simple strategy can help you get in the market early, and catch more profits.
But you have to make sure that you'll always place a stop-loss to reduce risks and protect your account.
Strategy #2 - Looking for Stochastic Divergence
The next indicator you'll want to look at is the stochastic oscillator (SO).
The stochastic oscillator is a momentum indicator that uses two moving averages to compare the current price to previous prices.
Similar to the Relative Strength Index (RSI), the stochastic also indicates overbought and oversold conditions of the market. It will show you how strong the current trend is.
The best strategy is to use this indicator as a way to identify potential reversal signals. This will help you confirm a downward breakout on the inverted cup handle pattern.
You can look for divergence between the SO and the price action. Divergence occurs when prices move in a certain direction, but the oscillator is moving in the opposite direction.
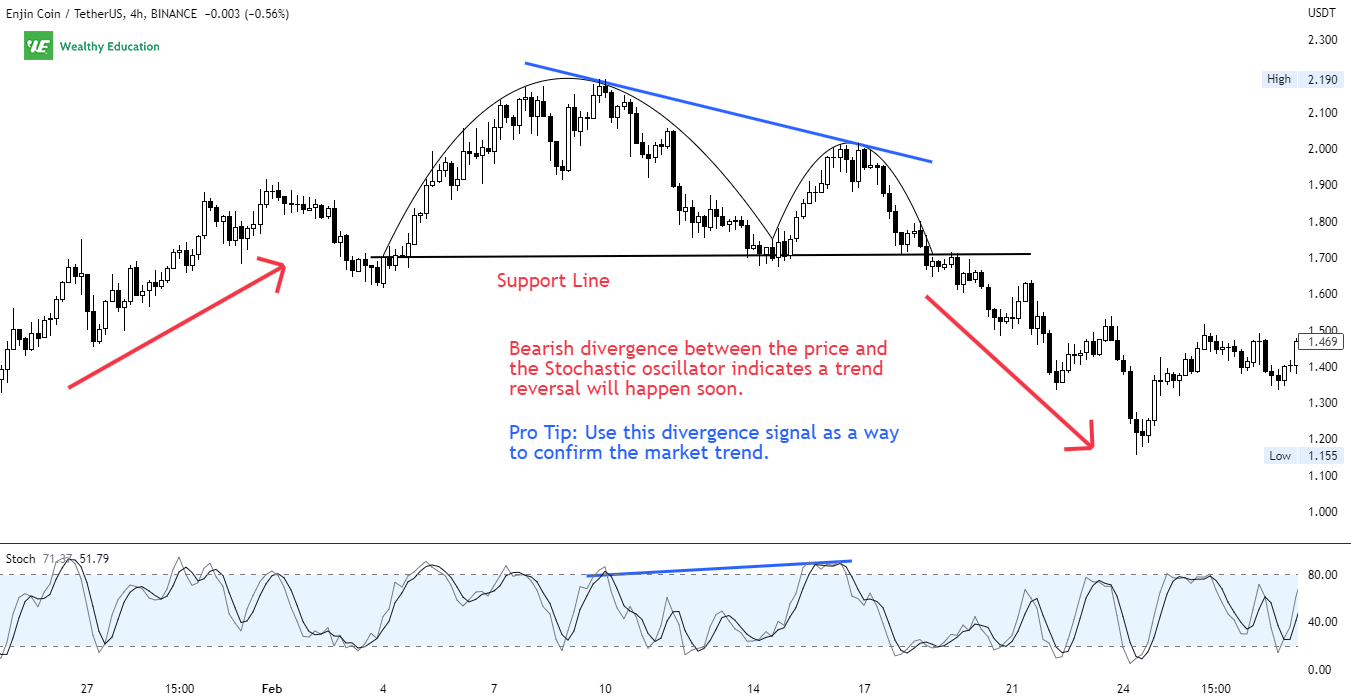
As you can see on the chart, stochastic divergence occurs when the price rebounds and reaches the high of the handle. The EMA 20 line acts as a dynamic resistance that prevents the price to go up.
These signals indicate that a strong downtrend is coming, so it's not a good idea to go long. We'll consider going short instead.
Strategy #3 - Volume is Your Best Friend!
If you ignore the importance of trading volume, then you really miss a lot of opportunities to make money in the market.
Volume is the single most useful indicator in technical analysis. It reveals valuable information about supply and demand, and gives you a clear signal about the strength of a trend.
That's to say, you can use volume as a way to confirm a breakout.
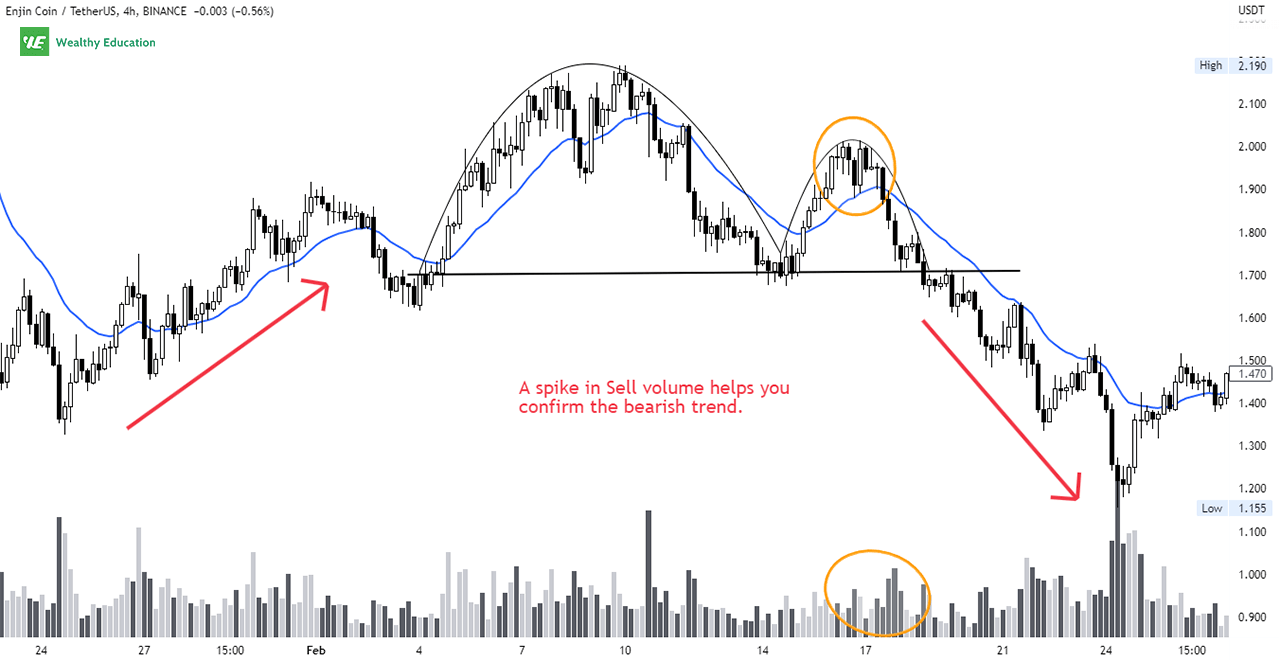
Let me remind you that the inverted cup and handle breakout is only confirmed when the price action closes below the support line.
And the thing is that breakouts usually happen on high volumes.
So the next time you're planning to trade the cup and handle, make sure you look at how much volume has been traded during the decline.
If there's a spike in selling volume, then it's a sign that traders are rushing to sell off their positions, and the bears are dominating the market sentiment.
The Bottom Line
So there you have it! The 3 best trading strategies that you can use to identify and trade the inverted cup with handle.
But remember that this pattern doesn't work all the time.
And you still have to be vigilant and watch for contrarian signals to stay safe. Please don't lose all your money on bad trades.
Well, day trading is risky after all!
That's why you need to use other technical indicators along with this pattern to time your entries correctly, and increase the odds of your success.

