I’m sure you’ve heard so many great things about a bear pennant pattern, and how it's taking the trading world by storm.
You know, those little wiggles on the stock chart that make it look like we're being attacked by a bear.
Well, you might be wondering: What's so special about this?
My students tell me that there is a lot of confusion around this chart pattern, so I thought I'd put together a guide on how to identify a bearish pennant breakout.
With this comprehensive guide, you're always prepared for market volatility, and you'll never regret missing out on any highly profitable trades again.
Now let's jump into it.
What is a Bear Pennant Pattern?
A bear pennant chart pattern is a technical analysis pattern that signals a continuation of a bearish trend.
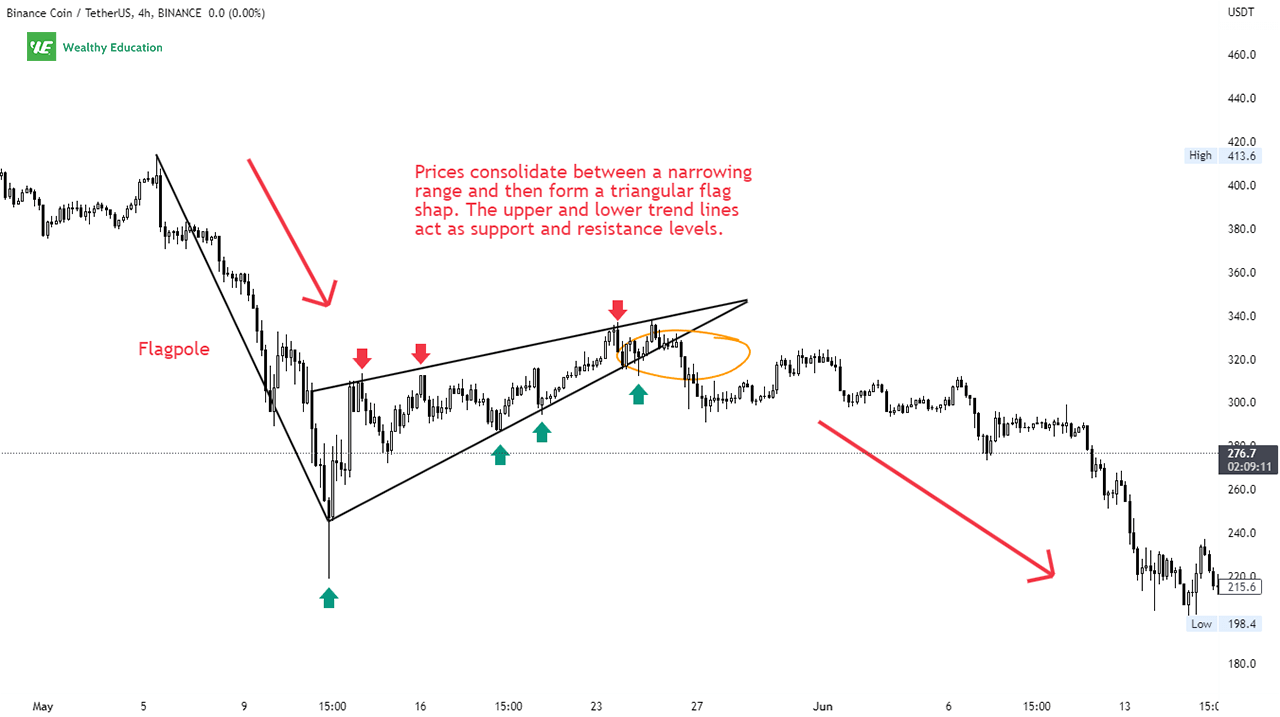
It is formed when the price action makes a series of lower highs and higher lows that creates a triangular flag at the bottom of the market.
The pattern is made up of a flagpole and a pennant.
- The flagpole is typically created by a steep decline in price, followed by a short period of consolidation.
- The pennant is created by two converging trendlines that form a symmetrical triangle. The pattern looks like an ascending wedge if it slopes upwards.
The bear pennant formation gets its name because it's usually followed by a strong downtrend.
This signals a pessimistic outlook on the market, and often leads to further declines after a breakdown from the pattern.
You can use this bearish chart pattern as a typical signal for going short the market, or you can use it as a breakout indicator to confirm an existing downtrend.
A breakout to the downside occurs when prices break below the lower trendline of the flag formation.
When this happens, there is a high probability that the prevailing downtrend will continue as the support level has been broken.
How Do You Tell If a Pennant Is Bullish or Bearish?
To answer this question, you need to understand the characteristics of a pennant formation, and how it significantly affects the direction of the overall market.
Pennants are considered to be continuation patterns, which means that they signal a continuation of an existing trend.
So, for example, if the market is trending up, a formation of a bull pennant pattern will likely lead to a continuation of that uptrend as the bullish momentum continues.
And vice versa, if you're in a downtrend, and you see a bear pennant chart pattern forming, it's likely that the bearish momentum will continue after a breakdown from the formation.
So if you want to tell whether a pennant is bullish or bearish, you just need to pay attention to the direction of the prevailing trend.
However, the bear pennant breakout direction also depends on the shape of the triangle and the length of the flagpole.
The breakouts perform better during strong downtrends with a taller flagpole and a wider triangle shape.
Formation
A bear pennant is a continuation pattern that forms when there is a strong downtrend, and the price action starts to consolidate in a small trading range.
When you draw two converging trendlines that connect the highs and lows of the consolidation, you'll see a chart pattern that looks like a triangular flag on a pole.

The two trend lines act as support and resistance levels for the market, and the breakout direction depends on whether prices break the support or resistance level first.
In my experience, this chart pattern is very bearish because the overall market is pessimistic, and traders don't feel like catching a falling knife.
Most of the time, it signals a continuation of the prevailing downtrend after a downward breakout occurs.
The formation is complete when the price action breaks below the lower trend line of the pennant.
The breakout often comes with strong selling pressure (volume) after the bears dominate the market sentiment.
You should notice that the pattern is most reliable when the consolidation period lasts between 2 and 3 weeks.
If it lasts longer than that, then it becomes a symmetrical triangle instead of a pennant. This means that it may break out in either direction when the support or resistance level is broken.
Example
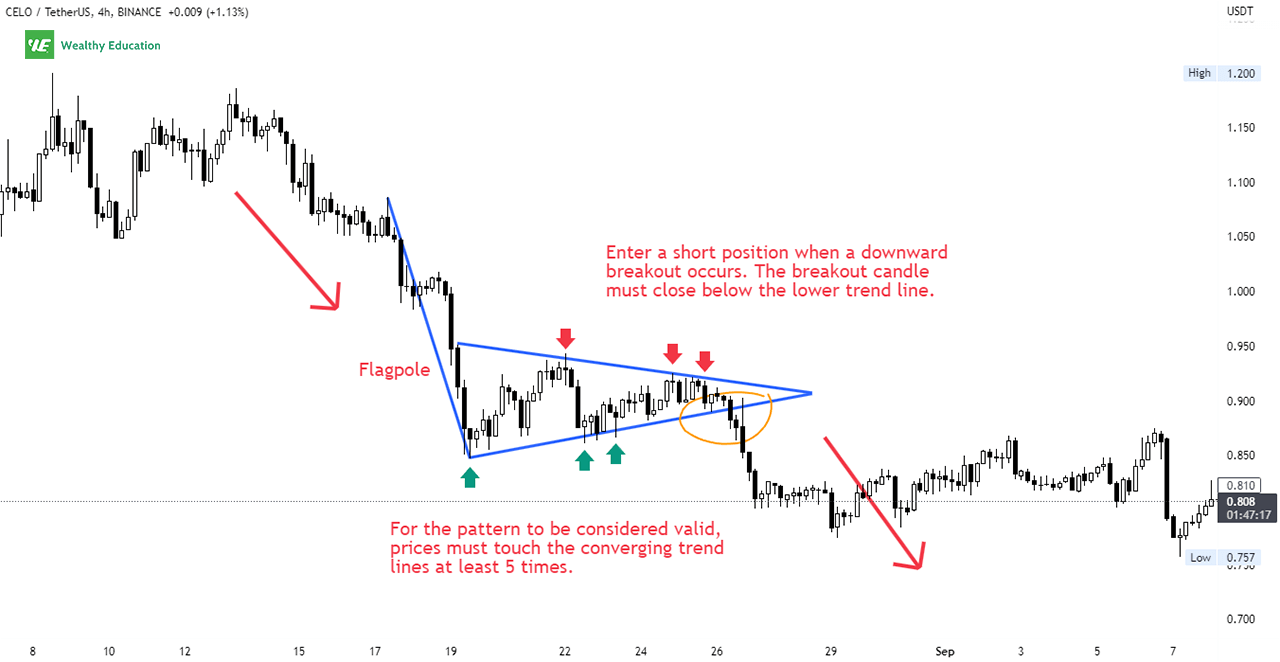
Now let's have a look at a quick example of the bearish pennant chart pattern on Celo (CELO/USDT).

As you can see, there was a strong downtrend that started in mid-August. The price dropped by around 40% from $1.185 to $0.848, and then it consolidated in a tight trading range for about 5 days.
By drawing 2 trend lines to connect the minor highs and lows of that consolidation period, you can see the bearish pennant formation on the chart above.
The occurrence of this pattern tells us that there was a clear down-trending tendency in place with persistent selling pressure.
A downward breakout occurred when the bears took control of the market and started selling aggressively.
How to Trade a Bearish Pennant Pattern
The bear pennant trading strategy is quite simple. You just need to wait for a bearish pennant formation on the chart, and then enter a short position when the price breaks below the pennant's lower trendline.
This breakout can be a strong move, so you'll want to use a tight risk-to-reward ratio to maximize your profits and minimize your losses.
The flagpole plays an important role in this trade setup, because it represents the initial move, and determines how strong the subsequent drop will be.
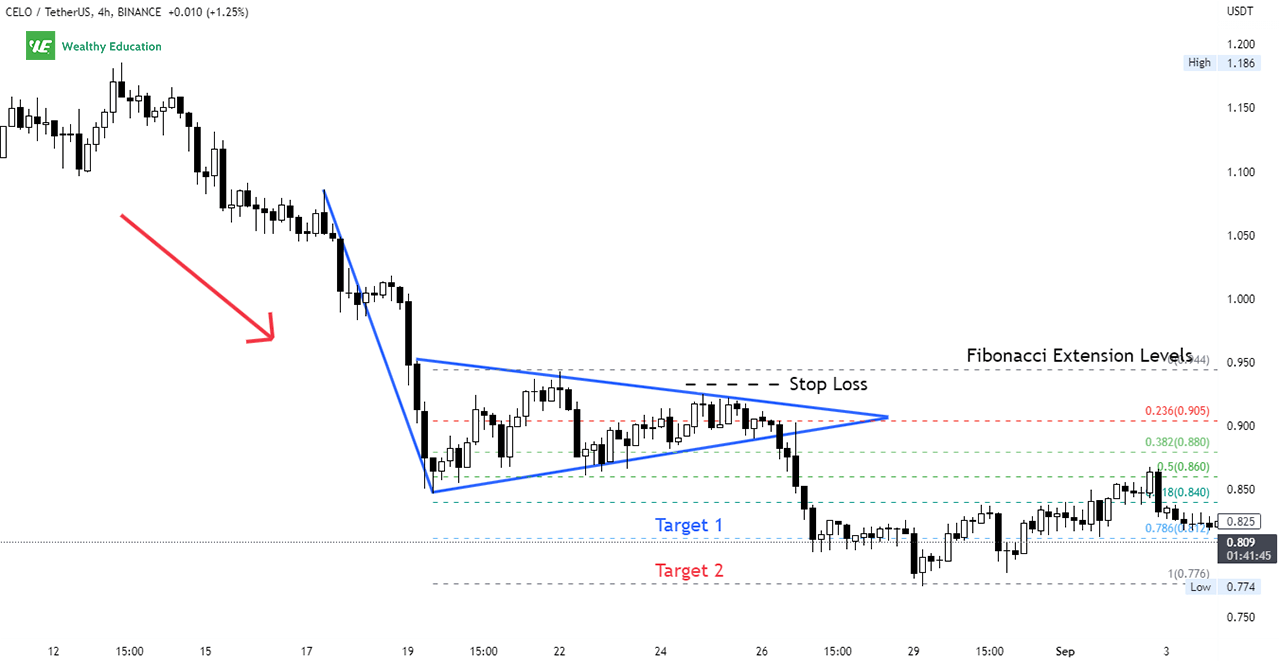
Your profit target can be the same as the flagpole's height; however, I would recommend you use Fibonacci levels instead.
The Fibonacci tool is more reliable when determining potential targets because it provides support and resistance levels based on previous price actions.

A stop loss can be set based on your risk appetite. I personally place a stop loss above the top trendline.
You should also pay attention to the bear pennant trading volume. Normally, the volume is diminishing when the pennant is formed, and then increases sharply once the breakout happens.
The triangular flag pattern is a relatively reliable predictor of future price movements, but there are a few things you need to keep in mind.
First, the pattern is not always accurate, and second, it can be easily misinterpreted.
To avoid making costly mistakes, you need to wait for the breakout candle to close below the support line.
In addition, you should use other technical indicators and oscillators, such as Moving Averages and RSI, to confirm the breakout.
Can Bear Pennants Break Up?
Pennants are considered to be continuation patterns. However, you should take into account that they can also signal a reversal of the market.
This simply means that the pattern may not follow the previous trend's direction, and it may break up instead.
Even though pennant patterns have a high success rate in predicting future price movements, sometimes they can lead to false breakouts (or failures to break out) and "whipsaw" your trade setups.
FYI, whipsaw in trading means that you open a trade in the direction of an existing trend, but then you end up closing out at a loss as the market reverses its direction.
So that's the reason why I keep telling you to "wait for confirmation" before taking any position.
You'll want to see some bearish candlestick patterns like a shooting star or an engulfing, as well as reversal signals like divergences on MACD and RSI.
Can You Tell Them Apart?
The bearish pennant formation sometimes looks identical to other trading patterns that resemble a wedge or triangle, such as a rising wedge or ascending triangle.
Therefore, you need to know the key characteristics of these patterns so that you can quickly differentiate them from each other.
This will help you filter out false signals and avoid entering trades on the wrong side of the market.
Now let's do a quick comparison.
Bear Pennant vs Symmetrical Triangle
A symmetrical triangle pattern is a continuation pattern that occurs when the market consolidates in a narrow trading range.
Connecting the peaks and troughs of the consolidation by two converging trend lines, you'll get a triangle shape on a chart.
As you can see, these two patterns are easy to confuse with each other because they look exactly the same. So how can you tell the difference?
Here are some key differences between these two formations:
- Triangle patterns can appear in both uptrends and downtrends, while bearish pennants often form in the middle of a downtrend.
- The consolidation phase in the bearish pennant pattern lasts between 2 and 3 weeks, which is much shorter than that of the symmetrical triangle.
- A breakout from the pennant usually occurs in the same direction of the leading trend, while a breakout from the triangle can occur in any direction.
- The take-profit target for the triangle formation is the height of the consolidation range, while in the bearish pennant it's the height of the flagpole.
In my opinion, the bearish pennant is more reliable than the triangles because it breaks out in the direction of an existing trend.
This means it's much easier for us to predict the next major bearish move by riding the trend down, instead of guessing whether it'll go up or down.
Bear Pennant vs Bear Flag
You can see that these two patterns are similar in terms of characteristics; however, they look slightly different when drawn on a chart.
A bear pennant stock pattern is formed when prices consolidate between two converging trend lines, and create a small triangular flag that slightly slopes upwards.
On the other hand, a bear flag pattern is typically created by two up-sloping horizontal trendlines that form a rectangular flag.
The bearish flags and pennants both occur in a down-trending market, and they share many similarities in terms of breakout direction and profit targets.
Bear vs Bull Pennant
A bullish pennant pattern is created when the price action rallies and then moves sideways in a narrowing range before resuming the prevailing uptrend.
The bullish and bearish pennants are continuation patterns that both indicate a pause in the current market trend.
Here are the main differences between these two formations:
First, the bullish pennant pattern occurs during a strong uptrend, while the bearish one occurs during a downtrend.
Second, you can notice that the triangle part of the formation usually slopes up in the bearish pennant pattern, while it slightly slopes down or looks flat in the bull one.
Finally, a breakout direction is determined by the leading trend. Therefore, the bullish formation tends to break out to the upside, while the bearish one is to the downside.
What Happens After a Bear Pennant?
After the bearish pennant forms, the price typically breaks down below the support trendline, and continues the existing downtrend.
Depending on which time frame you're trading on, this decline can last from a few hours to several weeks.
During this time, the overall market sentiment becomes negative, and long traders tend to cut losses quickly by selling off their positions.
The sell-offs will make the price drop to rock bottom, and encourage more sellers to enter the market along the way.
When the selling pressure increases, the price moves lower until the market becomes oversold.
Eventually, when the bears are exhausted, the bulls will step in to stage a counter rally that pushes the price back up to test the resistance line again.
The market will then recover and resume its upward trajectory.
Summary
A bearish pennant chart pattern is characterized by a sharp drop in price, followed by a sideways trending period. It's normally used to confirm existing bearish tendencies in a market.
You will see prices move up and down between two converging trend lines, which form a triangular flat shape at the bottom of the market.
The consolidation signals a pause in the prevailing downtrend, and it's time for traders to prepare themselves for the next big move.
A breakdown occurs when prices move lower, and close below the support trend line of the formation.
When this happens, you can enter a short position with a stop loss above the most recent high (or the high of the triangle).
Your stop loss should be placed just above the upper trendline of the pennant, and you can take profit at the next support level below the breakout point.
Remember that there's no perfect entry - the best you can do is to wait for the market to confirm your entry point.
That's why you'll need to use this pattern with other indicators and candlesticks to increase the accuracy of your chart pattern analysis.
Finally, you need to ensure you fully understand the risks involved when trading this chart pattern.
This includes being aware of the potential for false breakouts, as well as the bearish pennant reversal probability.

