Have you been trading the descending scallop pattern? If not, then you're going to love this article!
You'll see this pattern all the time on stock charts, and it's a reliable continuation chart pattern that can give you big profits if you know what you're doing.
However, you can only make the most out of this powerful pattern when you have a proper risk management system.
Most traders chase losses and end up in big trouble when they trade in a downtrend. That's because they don't know how to properly manage risk.
Trust me, without proper risk management techniques, your trading account will get wiped out in no time.
In this article, I'll teach you a low-risk trading strategy that you can use to trade the descending scallops. You'll never have to worry about taking unnecessary risks again!
Now let's jump right into it.
Descending Scallop Pattern
A descending scallop pattern is a short-term bearish continuation pattern that occurs near the market bottom.
It is characterized by a sharp decline in price, followed by a short-term pullback, and then another decline to form a lower trough.
You will see that the price action makes this formation look like the letter J reversed on a stock chart.
When you find descending scallop patterns forming on a chart, you can predict that the existing downtrend will continue in the short run.
The pullback happens when the market attempts to find a support level and reverse the trend direction.
However, due to strong selling pressure and the absence of buying interest, the price fails to move back up and ends up closing below the support level.
This adds bearish sentiment to the market and pushes it further into a deeper sell-off.
The pattern is fully complete when a downward breakout occurs through the bottom of the scallop formation.
This is usually accompanied by a spike in selling volume as it confirms that sellers are in control of the market.
Example
Now let's consider a quick descending scallop example so you can see exactly what this pattern looks like on a price chart.
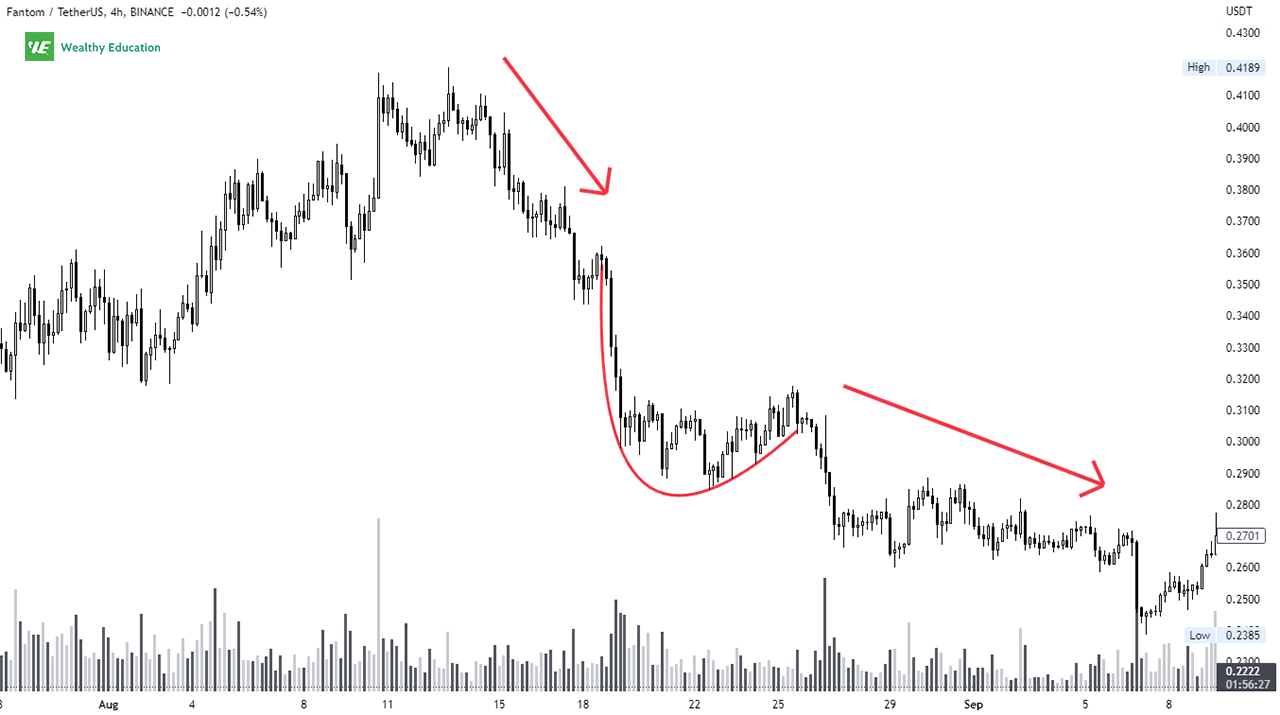
The chart below shows a clear descending scallop chart pattern that has formed on the 4-hour time frame of the Fantom chart (FTM/USDT).

As you can see, the FTM token had been trading in a downtrend before it started a short-term recovery move in late August.
The price failed to break out above the previous support line (now resistance) and eventually started to move back down again.
The prevailing downtrend continued when the price closed below the bottom of the descending scallop formation.
Selling volume also spiked up during the downward breakout as more and more sellers entered the market to push the price down further.
You could use this as a confirmation signal to initiate a short position on the FTM token and wait for the next leg down to play out.
Now let's pay attention to the bottom of the pattern. You want to see a bowl-shaped bottom that appears as rounded and smooth as possible.
If the price action looks like it's forming a V-shaped bottom, then this is not a valid descending scallop formation and you should ignore it completely.
How to Trade Descending Scallops
Now let's dive into the descending scallop trading strategy so you know exactly what to do next time you see this pattern form on a price chart.

The first thing you want to do is to look for a bearish trend that has been in place with a consistent pattern of lower lows and lower highs.
Since the descending scallop is a bearish pattern, you want to ensure that the overall market sentiment is negative before initiating your short trade.
Then, you want to see prices going sideways or moving in a lower range with no clear direction for a while.
The consolidation period should be followed by a temporary reversal to the upside. This is when the market retests its previous support and resistance levels.
You can enter a short position when the market shows signs of weakness and fails to break above the previous resistance line.
In this case, you want to see a bearish reversal candlestick form right at the resistance line to confirm the upcoming selloff.
Bearish candlestick patterns include a shooting star, hanging man, dark cloud cover, or a three black crows formation.
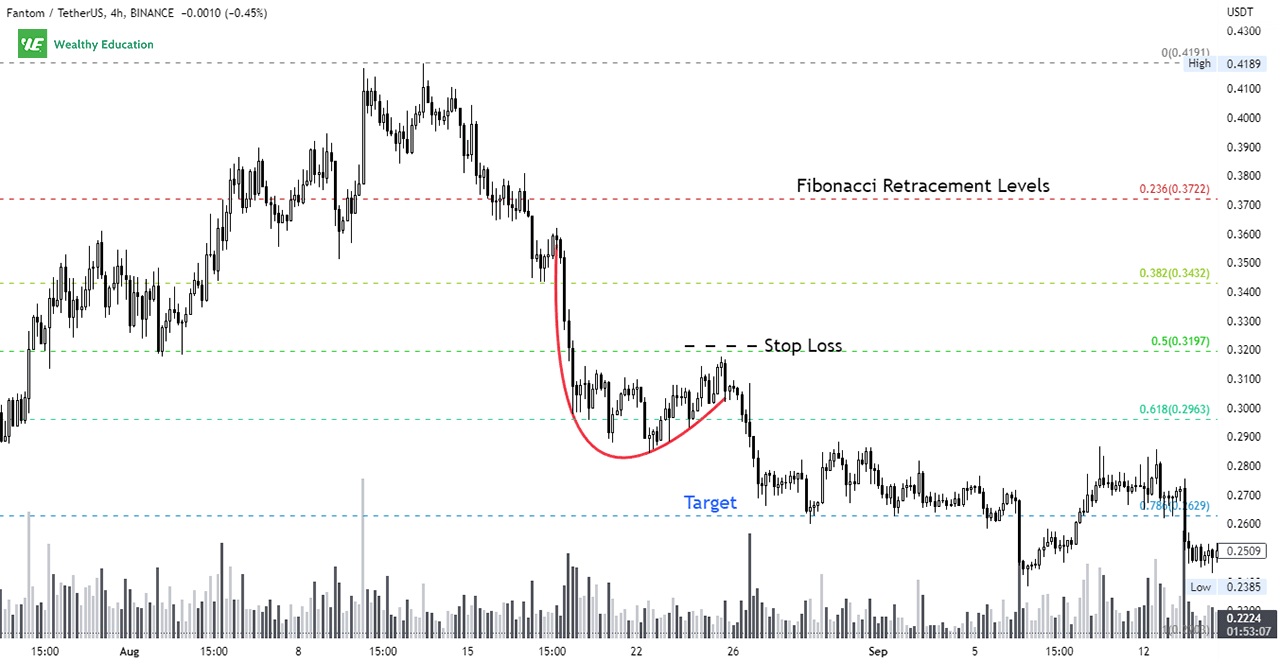
Your price target can be set based on the height of the formation, previous support and resistance levels, or Fibonacci retracement levels.
Always make sure that you'll place a stop loss just above the recent pullback to protect your account in case the market moves against you.
Inverted Descending Scallop Pattern
An inverted descending scallop pattern is a short-term bearish chart pattern that signals the continuation of an ongoing downward price trend.
This pattern is very similar to its regular counterpart, but it shows up as an upside-down J when drawn on a chart.
It's created when prices trend downward and then pull back up quickly and round over at the top before resuming the downtrend.
When this occurs, prices tend to dip below the previous low and then continue falling straight down to an even lower price level.
This is typically followed by a surge in selling volume and an extremely negative bearish sentiment in the market.
As a result, this drives the price lower to the next support level and eventually pushes it into a deeper sell-off.
The descending and inverted scallop pattern is complete when prices close below the lowest low in the formation after a strong downward breakout.
Example
Now let's take a look at an inverted and descending scallop example so you can see how this pattern forms on a price chart.
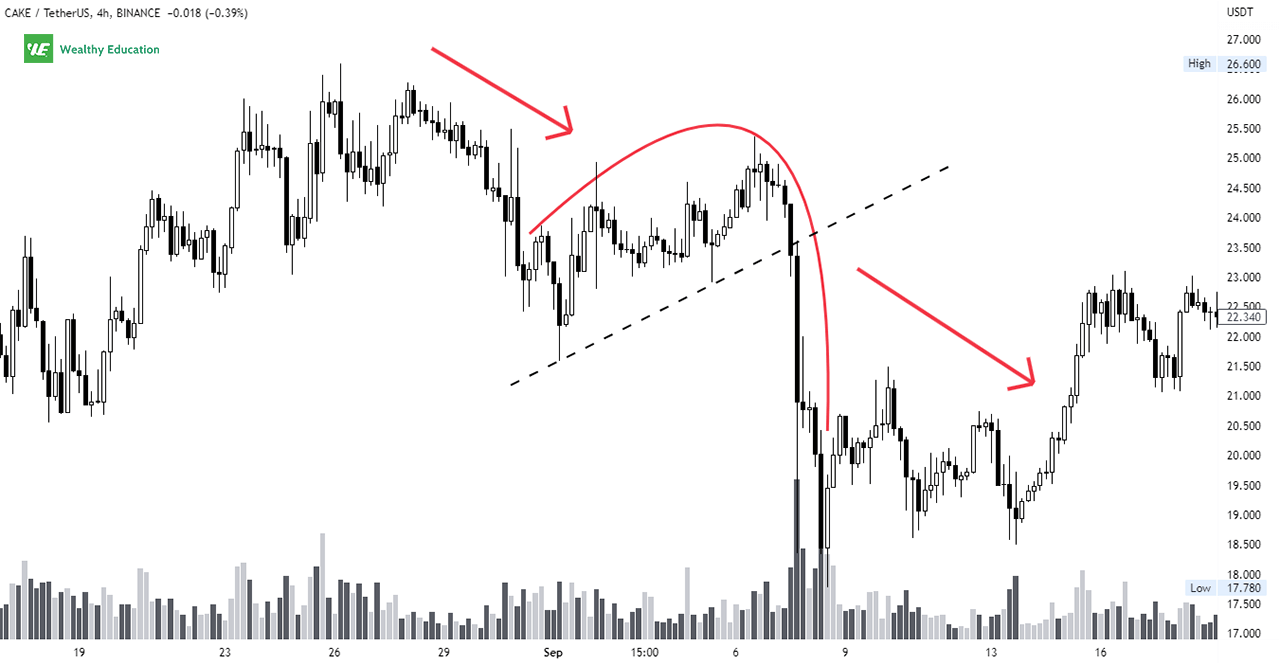
The example I'm showing you is of the Pancakeswap token (CAKE/USDT) on the 4-hour time frame.

As you can see that the market started a downward move in late August, but then bumped up in early September before plunging down again.
Notice how sharp the decline was in this case, and how quickly the price action broke down through the support trendline.
That was a sign of extreme selling pressure as sellers were pushing the market down aggressively without any sign of hesitation.
This was also confirmed by a spike in selling volume and a long black candle closed right below the support line.
How to Trade Inverted Descending Scallops
Now that you've seen what the inverted descending scallop formation looks like, let's find out the best way to trade it.

This pattern often acts as a bearish continuation pattern and confirms the existing downtrend in the market. This means that it works well as a sell signal.
To trade this pattern effectively, you should be on the lookout for some bearish candlestick patterns to form at the top of the pullback.
As always, you want to see some sort of confirmation and other bearish trading signals before initiating your short position.
For example, you want to wait for an evening star or a bearish engulfing to form to confirm a bearish trend reversal.
If there's no confirmation signal, you should avoid trading the inverted descending scallop chart pattern and wait for a more reliable setup.
You can place a sell order when the price breaks down through the support trend line and closes well below it.
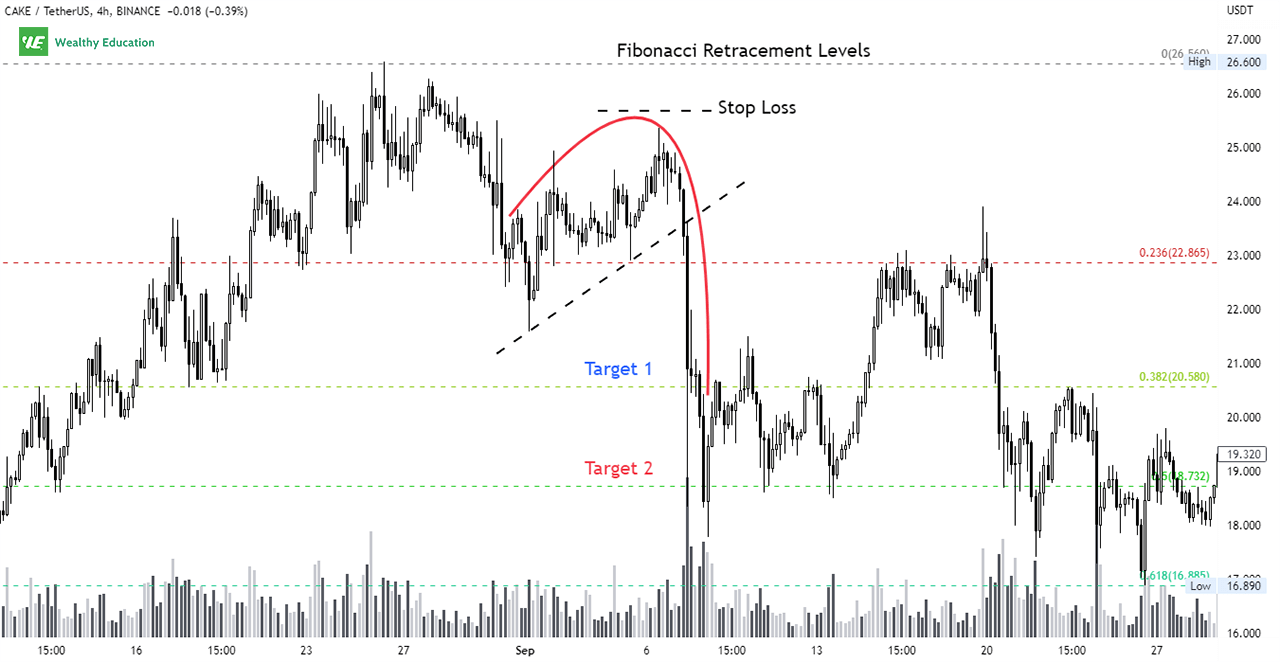
Your target price can be determined based on Fibonacci retracement levels, and your stop loss can be placed above the top of the recent pullback.
If you want to trade it safe, you can wait for the price to close below the lowest low in the pattern, and then you can trigger a short sell order.
The Bottom Line
If you're looking for a powerful short-selling signal, then you can consider trading the descending scallop formations.
They appear near market bottoms, and they confirm the ongoing downtrend with extreme selling pressure and strong downside momentum.
But keep in mind that you need to have a lot of patience and discipline to trade this pattern profitably as it requires perfect timing to execute your trade.
You'll need to wait for a proper setup to occur before you can pull the trigger on your trade. Otherwise, you'll end up getting stopped out prematurely.
This pattern is more reliable when the market is in a downtrend, but it can also appear in an uptrend.
In my experience, the descending scallop stock pattern works better as a bearish continuation pattern.
So, I wouldn't recommend trading this pattern in an uptrend because you'll likely get stopped out too often.
As with all popular chart patterns, you want to pay attention to the overall price action and trading volume before jumping in.
And make sure that you'll use other trend-following and momentum indicators to confirm and support your trading decision.

