Just the other day, I was watching a stock chart and saw a rounding bottom pattern. I knew this was an opportunity so I took the trade.
I had no idea what was going to happen. But by the end of the day, my profit was more than 200% for one single trade.
There's more to this story than just a nice gain though. I actually think the rounding bottom formation is a total game-changer in the trading world.
This pattern is one of the most reliable chart patterns in the market right now, but that doesn't mean that it's easy to trade.
For example, if you enter or exit the trades too fast, you'll find yourself getting whipsawed out of your position.
As a result, you lose money - And if you're especially unlucky, you could even end up losing every penny that you have in your account.
So what should you do? The key here is to have the patience to let these setups play out completely.
Yes, it's a powerful formation, but you need to approach it the right way if you're serious about improving your trading results.
That's why I wrote this article to show you how to trade the rounding bottom stock pattern correctly every single time.
Once you understand how it works, you'll feel like you're trading like a pro! It's pretty straightforward, so don't miss out on this great opportunity.
Now let's get to it. There's lots more to cover!
What is a Rounding Bottom Pattern?
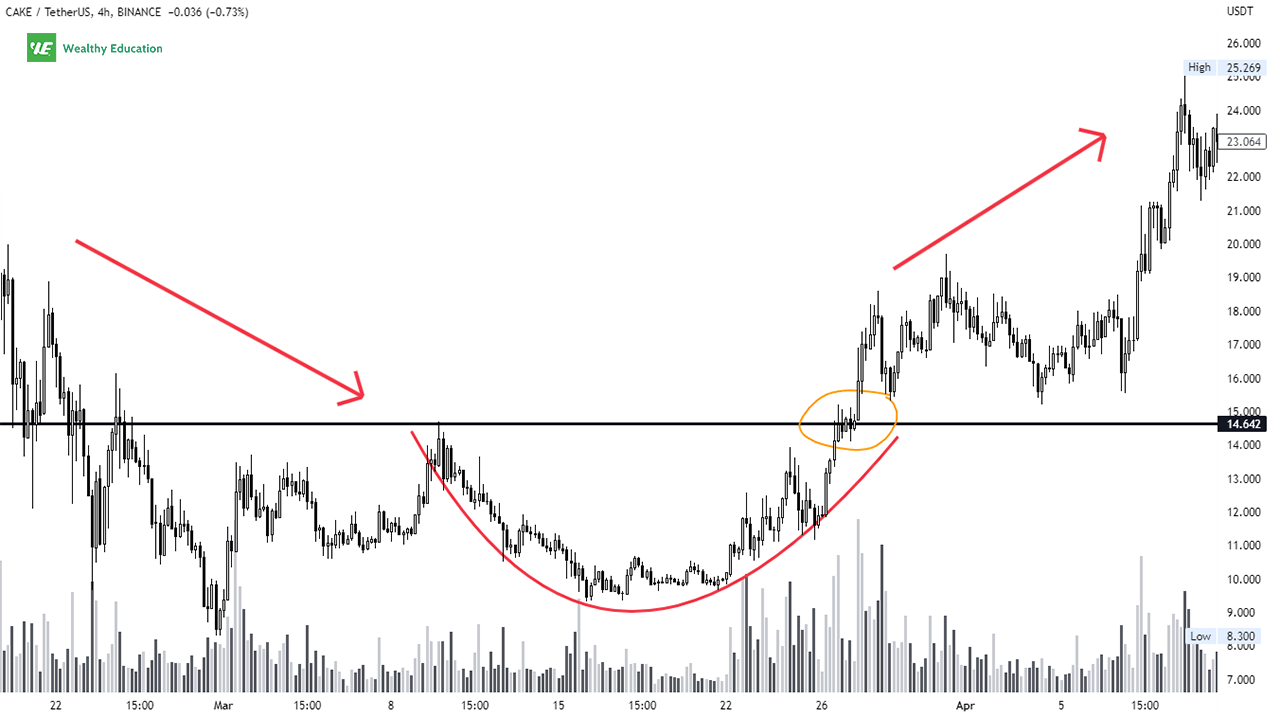
A rounding bottom pattern is a long-term reversal pattern that appears at the market bottom after an extended downtrend.
It's characterized by a U shape or bowl formation at the end of a downward move, followed by a reversal to the upside.
You usually see this technical analysis pattern when the market has been falling for weeks or months and starts to flatten out around an extreme support level.
During the rounding bottom formation, prices move down smoothly in a curved path and gradually reverse direction when the market bottoms out.
Prices then approach the rim of the bowl or the horizontal resistance trendline with increasing volume before they finally break out.
The pattern is fully complete when prices break up through the resistance trendline and close well above it.
When the upward breakout occurs, it signals that the bulls are taking over the market again as the bearish momentum fades away.
This also indicates a major shift in market sentiment from bearish to bullish, which paves the way for a new uptrend to emerge.
As a result, the market usually moves up sharply in the direction of the rounding bottom breakout and marks the end of the previous downtrend.
The rounding bottom chart pattern is also referred to as a saucer bottom pattern. The name comes from a series of price movements that form the shape of a saucer at the bottom of the market.
Sometimes it becomes a cup and handle pattern when prices hit the resistance level and then pull back down.
The pullback is what makes the difference between these two bullish patterns.
Rounded Bottom Formation
If you're looking to spot a valid rounded bottom chart pattern, there are a few things you'll want to look out for:
- The market has been in a prolonged downtrend or correction
- Price consolidates at the lows for some time and then moves in an upward sloping curve
- Volume increases during the upward movement
- A breakout above the rounding bottom rim or the key resistance level
First of all, you want to look for signs of an ongoing downtrend or strong correction in the market.
This is necessary for the formation of the rounded bottom pattern since these patterns usually appear at extreme lows in the market.
You don't want the pattern to form in the middle of a healthy uptrend because it'll just look like a normal bull run without any underlying fundamentals to support it.

You need to see strong selling pressure pushing the price lower in the first place, which creates buying demand later on when the trend reverses course.
After reaching the lowest point possible, the trend will flatten out for a while and then make a rounding turn upwards.
You want to pay attention to trading volume as well. The volume should show a gradual increase as the market advances towards the rim of the bowl before breaking out above it.
This indicates that buying demand is increasing as more buyers come into the market and fuel the recovery.
Eventually, this will lead to a buying frenzy and drive prices even higher until the breakout of the rounded top formation occurs.
The upward breakout is confirmed when the price action closes above the resistance level.
Now let's consider a quick example of a rounding bottom so you can understand exactly how it works.
Example
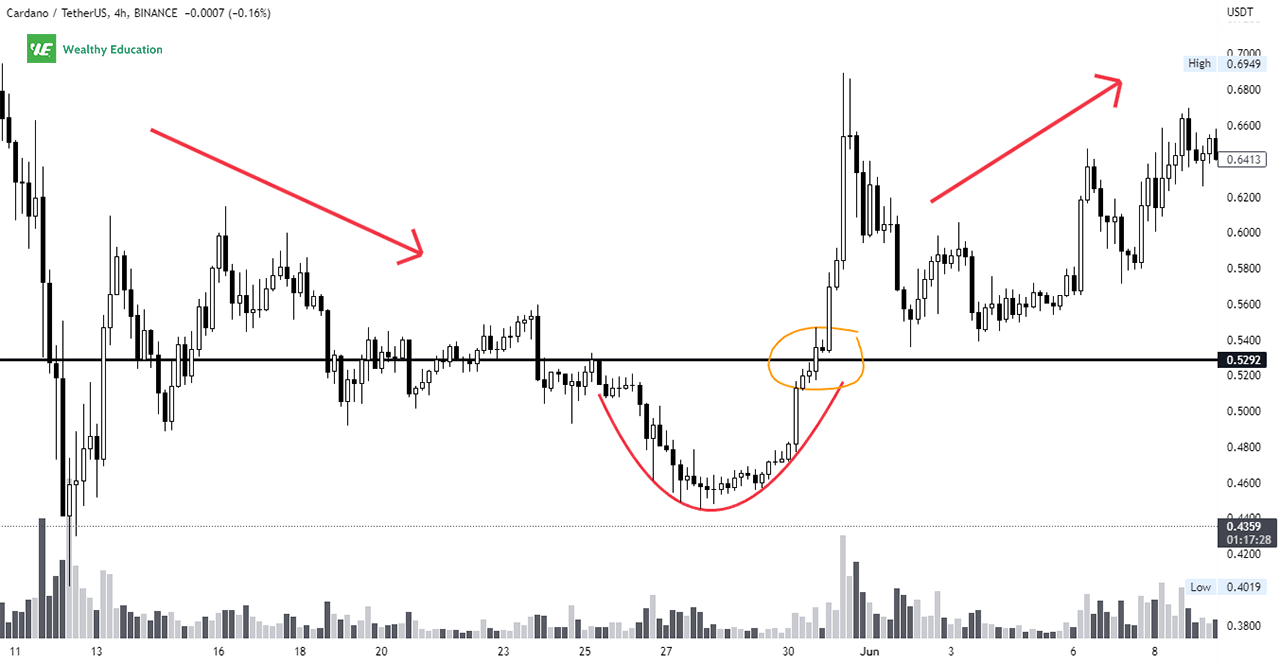
You can take a closer look at how a rounding bottom reversal pattern forms on the Cardano (ADA/USDT) chart below.

As you can see from the chart, ADA/USDT was in an extended downtrend for roughly two months until it reached a low of $0.4456.
Notice how the market formed a strong support area at this price level as buyers and sellers had been battling it out for control of the market.
Prices flatten out at this level for several trading sessions before making a rounding turn to the upside.
The volume also picked up gradually as the rally continued, and the price action eventually broke above the rounding formation on May 31.
This showed that bullish sentiment was slowly improving within the market and more and more traders were jumping back on board once prices started to recover.
The upward breakout marked the end of the prevailing downtrend and sent Cardano soaring higher to its previous high of$0.6894.
How to Trade Rounding Bottoms
The rounding bottom trading strategy is quite simple: you can go long once prices break out of the formation.
But keep in mind that you need to wait for confirmation before triggering your buy order, otherwise you'll end up losing your shirt if the breakout fails.
You want to see some sort of bullish reversal signals, such as high volume, candlestick formations, and oscillator divergence, to confirm the upward move.
Once you see such signals develop, you can place a buy order and wait for the price to rise toward your profit target.

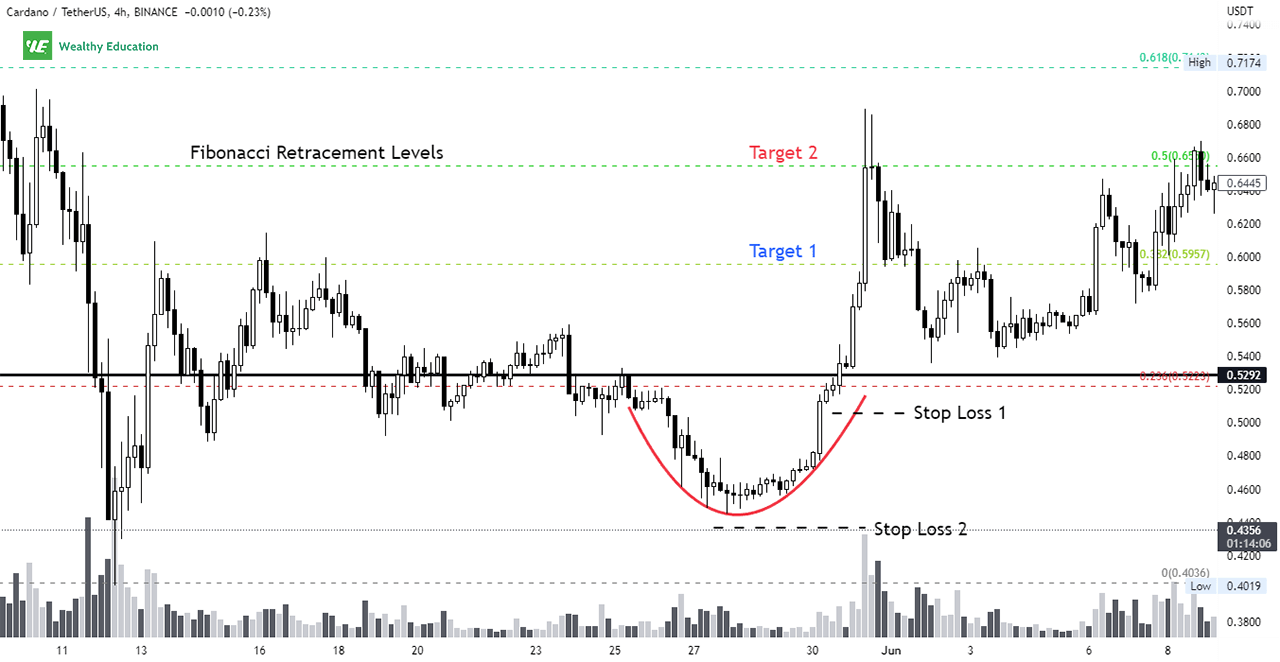
You can set your price target based on the size of the rounding bottom pattern or Fibonacci retracement levels.
Don't forget to place a stop loss order to protect your account from potential losses in case the trade goes south.
If the price hits your stop loss, make sure you'll exit the trade immediately to avoid further losses.
Don't make the same mistake that novice traders make: they just hold on to their losing positions in the hope of a miracle recovery that never comes.
Instead, you should look for other opportunities to make money in the market.
Waiting too long to exit your losing trade is a recipe for disaster that will cause you to lose more money in the end.
So make sure you always have an exit plan in place so you'll be able to cut your losses quickly and keep your capital intact for other opportunities in the market.
Performance Testing Results
I have carried out some performance tests to see if the rounded bottom trading strategy works as a bullish trend reversal signal.
I'm impressed by the performance of this chart formation. The breakouts that I traded over the past seven months worked pretty well and gave me an average win rate of over 72%.
This number is even more impressive considering that I never risked more than 1% of my account on each position.
In my experience, trading rounding bottoms in a bull market yields the best results with a much higher success rate.
Don't get confused because of what I said earlier: you don't want to trade this pattern when it forms in a middle of an uptrend.
What you want to look for is a rounded bottom pattern that forms after a downswing or strong correction of a bull market.
This allows you to take advantage of strong momentum in the uptrend and buy at a bargain when the market corrects.
When the correcting trend reverses course, you can ride the market wave and capture big profits along the way.
I've also found that the size of the pattern really matters. Tall and wide formations tend to perform much better than short and narrow ones.
In addition, a U-shaped or increasing volume trend usually leads to a more valid breakout than dome-shaped or flat volumes.
However, there are no hard and fast rules when it comes to trading rounding patterns, so you should simply pick the ones that look good to you and trade them accordingly.
And don't forget to use other technical indicators to filter out false signals so you don't end up on the wrong side of the market at the wrong time.
Summary
Finally, you've learned everything you need to know about rounded bottoms, and how to apply them in your trading strategy.
You typically find this pattern at the end of a bearish trend or strong market correction as a sign that the bulls are coming back into the market.
You need to look for four key elements to spot this powerful chart pattern:
- The market has been in a long-term downtrend or correction
- Price consolidation occurs at the market bottom for a while before moving in an upward-sloping curve
- During an upward movement, volume increases significantly
- Price moves up and breaks out of the rounded bottom formation
You can enter a long position once the stock price breaks out above the horizontal resistance trendline.
Similar to the rounding top pattern, your ideal target profit level can be the same as the height of the rounding formation.
To increase your odds of success, you need to pick the right market conditions and wait patiently for a high-probability setup to form before pulling the trigger on your trade.
But make sure you set your stop loss at an appropriate level to limit your risk in case the market goes against you.
Keep in mind that you can't win all the time even if you are able to spot these profitable setups.
That's why it's important to manage your risk properly and have a tight stop loss in place to protect your account.
Understanding this will help you improve your performance in the long run and turn you into a successful trader.

