Trading a double top stock pattern can be extremely profitable if you know what you're doing.
If you know how to spot this powerful chart formation, and you know how to trade it well, you could triple your money in just a few weeks.
That's the kind of return you can achieve with this setup if you trade it the right way at the right time.
The problem is, most traders just don't know how to do that. They sell too soon, and they bet against the trend.
They don't understand how it works, so they lose money. Then they quit, and they go into another losing streak.
I don't want that to happen to you. That's why I've created this comprehensive guide to help you learn how to trade a double top pattern profitably and master your chart pattern analysis skills.
In this article, I'll teach you the ins and outs of the double top stock patterns so that you can trade them with confidence and achieve the results you want.
Now let's jump right in...
What is a Double Top Stock Pattern?
A double top stock pattern is a bearish reversal chart pattern that looks like an inverted "W" shape on a price chart.
It's formed when a stock or index makes two consecutive highs at the same price level (two peaks) with a medium decline between them.
You will see this pattern occur at the end of a bull market, or in a strong uptrend when prices have failed to break a key resistance level twice.
This signals a potential reversal of the bullish trend, which creates a profitable short-selling opportunity if the price falls below the neckline of the formation.
The neckline is known as a confirmation line or a signal line that appears as a horizontal line that connects the lowest lows of the twin peaks.
This signal line serves as a strong support level and a break below this line confirms the formation of a double top.
A downward breakout occurs when the price breaks below the confirmation line and closes well below it, leading to a significant drop in the stock price.
Even though double tops are incredibly bearish, you should wait to see how the market reacts to the pattern before entering your short position.
Don't make the mistake of blindly shorting the market as soon as the price breaks below the confirmation line.
I'll tell you the reason why you shouldn't do that in a minute, but first, let's take a look at 4 types of double top patterns and what makes them different from each other.
Formation
The double top stock pattern is formed when the market makes two consecutive peaks at the same price level, which are known as the "twin peaks".
The price rises to form the first peak and then retraces back towards its neckline before rising again to form the second peak.
The neckline serves as an important support level and a break below this critical level signals a possible trend reversal.
A moderate decline of 10% to 30% between the two highs makes the pattern look like an upside-down W shape on a stock chart.
This decline should make each top stand out individually as its own minor high, rather than blending together to form a bigger one.
You should notice that the double top chart pattern must appear at the top of an upward price trend so that it can qualify as a top.
That's to say, you don't want to trade this formation when it appears at the bottom of a downtrend because it doesn't qualify as a reversal signal.
The double top trading pattern is easy to spot as it's often accompanied by a large spike in volume when the market makes its first peak.
Volume tends to drop significantly between the two peaks because the buying activity stops while traders wait for the second peak to form.
In my experience, the volume on the left peak is often higher compared to the right, and it usually trends downward from peak to peak.
Adam and Adam
The Adam and Adam double top reversal pattern (AADT) is a classic double top formation with two narrow and pointed peaks at the same price.
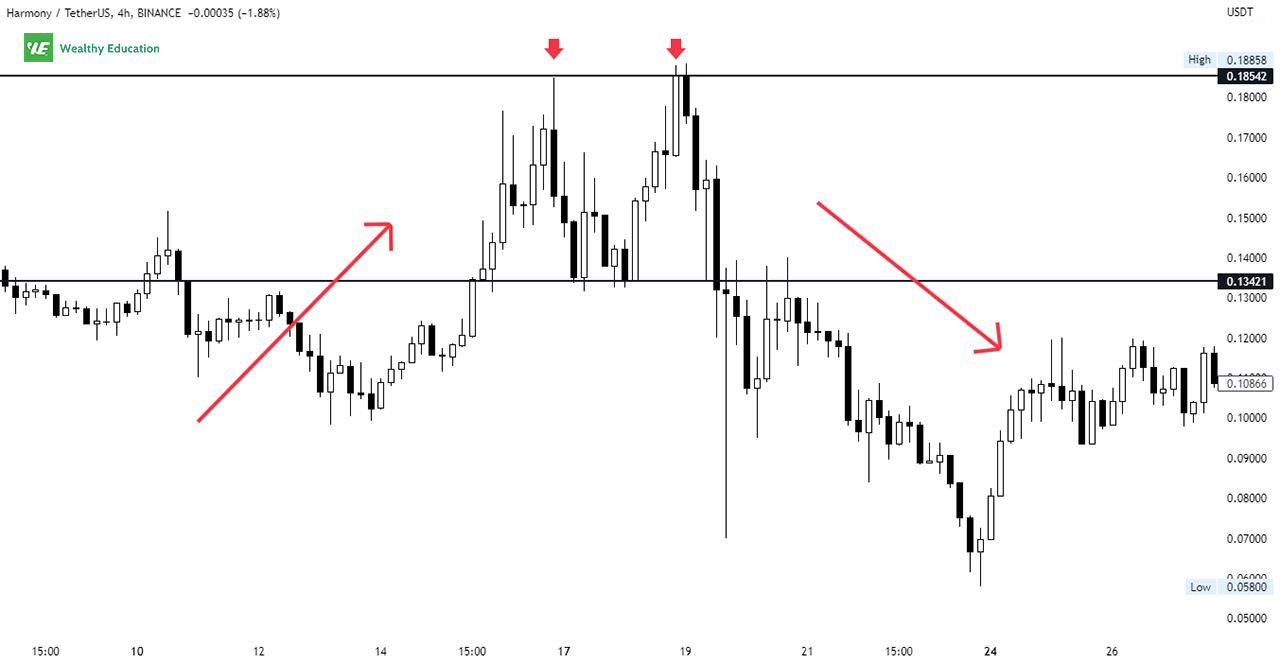
What makes the AADT different is that both of its peaks resemble the shape of an inverted V, and they look symmetrical when plotted on a stock chart.
This variant is associated with a U-shaped volume trend and heavier trading volume on the left top than on the right one.
Eve and Eve
The Eve and Eve double top bearish pattern (EEDT) is the second variant of the classic formation, and it has two rounded-looking tops.
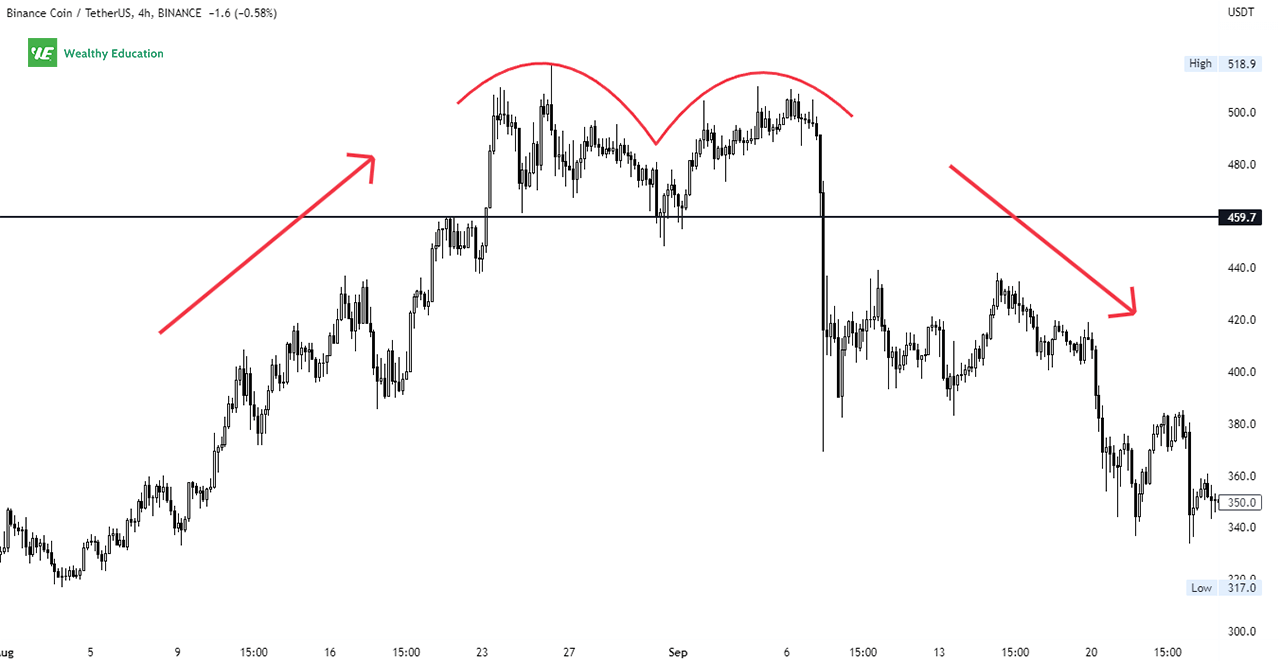
Eve peaks normally appear wide and rounded like inverted U's, but they're not exactly the same in size and they don't have to be perfectly symmetrical.
Just like the AADT, the EEDT also exhibits a higher volume on the left peak and often comes with a U-shaped or diminishing volume trend.
Adam and Eve
The Adam and Eve double top pattern (AEDT) is a mix of the above variants where the first peak looks narrow and pointed, and the second looks wide and rounded.
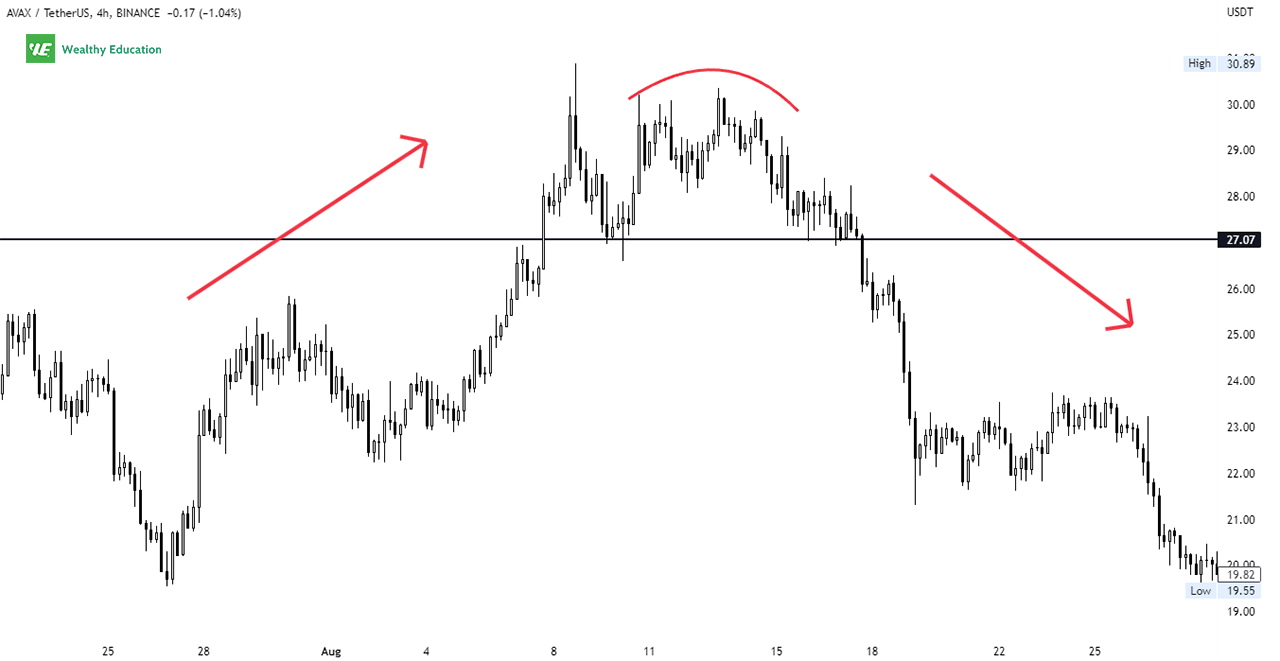
This is a relatively rare type of double-top pattern, but it still has some significance in technical analysis because it's often followed by a major decline in prices.
This variant often comes with a dome-shaped volume trend and heavier volume on the Adam peak.
Eve and Adam
The Eve and Adam double top pattern (EADT) is a combination of both the above Eve and Adam patterns, making it quite rare in nature.
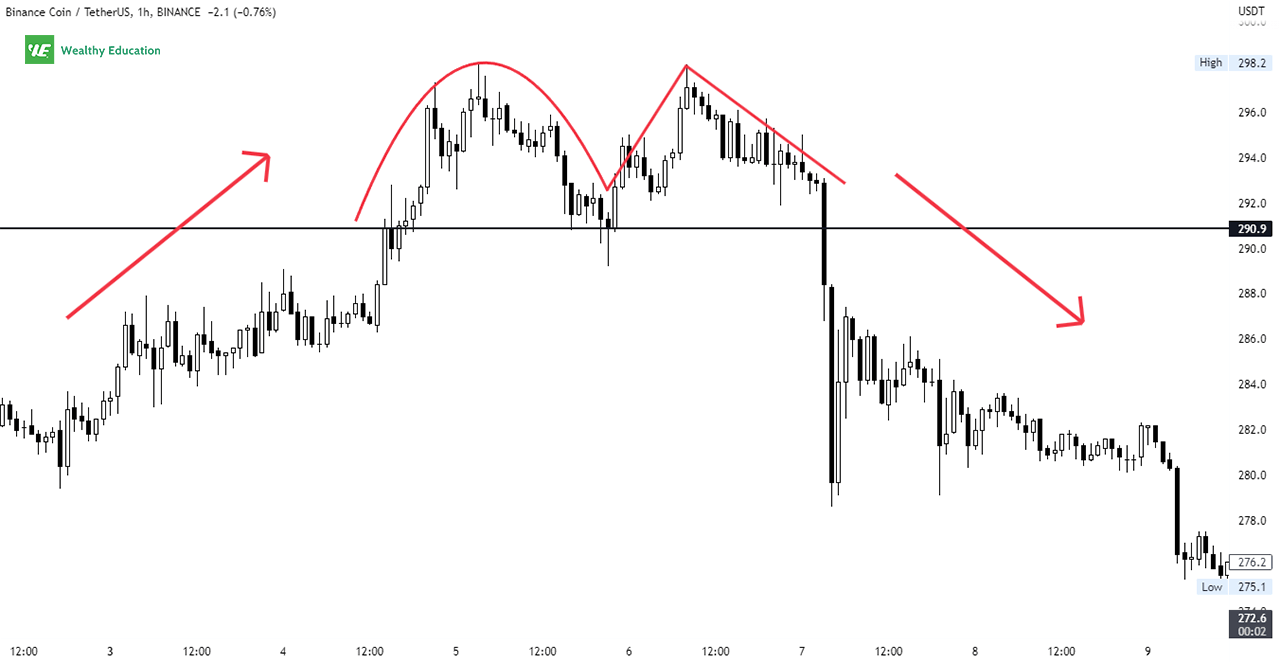
The EADT typically looks like a mirror image of the AEDT where the first top is wide and rounded, and the second is narrower and pointed.
This bearish double top pattern also has a U-shaped volume trend, but it usually comes with higher trading volume on the right peak.
Failed Double Top Pattern
Even though the double top pattern success rate is relatively high, it doesn't always result in a major price drop.
Sometimes, the market doesn't break through the support line which cancels out the pattern and the uptrend continues.
When this happens, you will see the pattern look like it's forming a double bottom on an upward price trend.
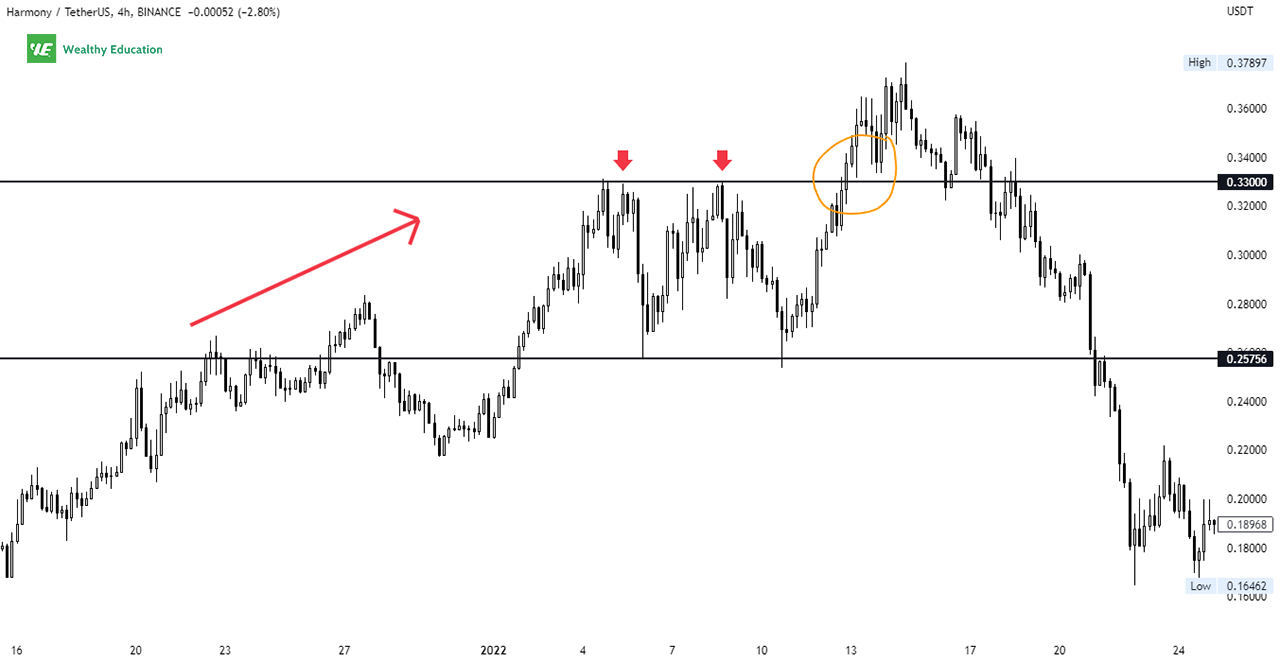
But keep in mind that, this is NOT a double bottom pattern because the prior trend leading to the pattern is not downward.
And this is why it's important to pay attention to the price action you're trading and not rely solely on the chart pattern itself.
Example
Now let's take a look at a double top example so you can see what it looks like on a real trading chart.
The example I'm showing you is of BurgerSwap (BURGER/USDT), a well-known automatic market maker built on the Binance Smart Chain.
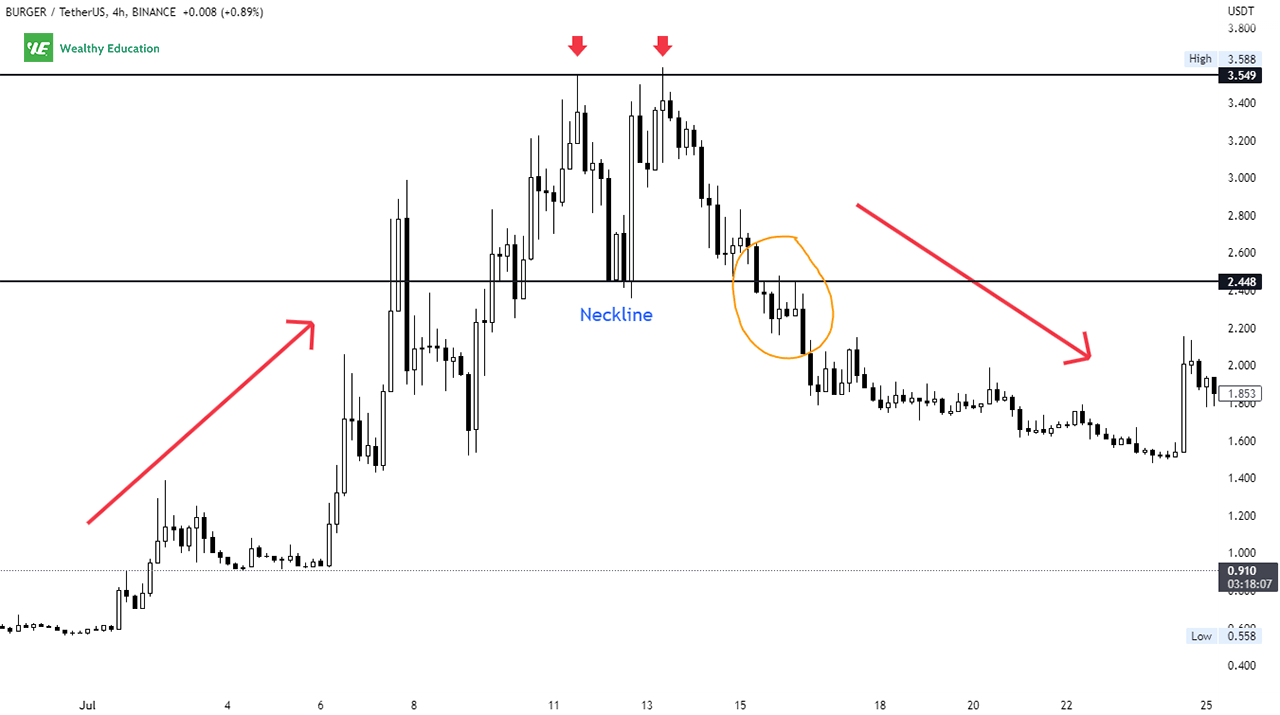
Chart Analysis
As you can see from the chart above, BURGER/USDT had been in a strong uptrend from Jun to early July, and it formed a bearish double top breakout pattern.
The coin made two successive peaks at around $3.55 before dropping sharply to the neckline at $2.35 where it found strong support.
The downward breakout was confirmed when the price closed below this signal line, and the coin dropped further to $1.52.
This was a heavy drop, which wiped out about two-thirds of the original rally from the recent low of $0.58.
What Happens After a Double Top Pattern?
When you see a double top (or a triple top) forming on a chart, you need to pay attention to the price action at the neckline area.
If the support holds, the trend will continue in the same direction as the prevailing trend. The uptrend will continue if the price stays above the support trend line.
However, if the price breaks below this trend line, it confirms the downside breakout of the pattern and signals that the trend is reversing downward.
How to Trade Double Top Patterns
The double top pattern trading strategy is fairly straightforward and easy to put into practice if you know what to look for.
All you need to do is to wait for the price to drop to the neckline area where it found strong support in the past.
A breakdown below this signal line with increased volume will confirm the double top bearish reversal pattern.
When this happens, it's the perfect time for you to look for short selling opportunities to enter the market and ride the trend all the way down for a nice profit.
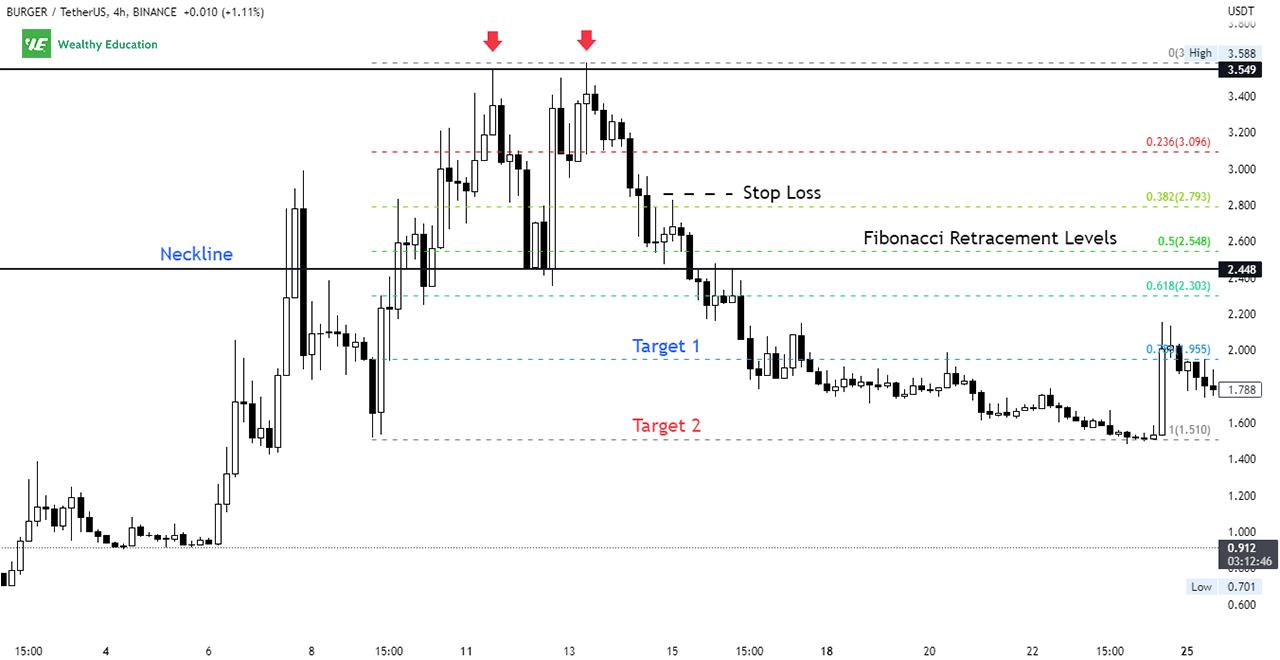
Breakout
A bearish trend reversal is confirmed when prices break out through the confirmation trend line and close below it.
This signals the end of the upward move and the start of a new downtrend. Therefore, you can expect further downside momentum once this happens.
Furthermore, the breaking of the neckline also confirms that buyers have run out of steam, so sellers are likely to take over the market and push prices lower.
This will eventually lead to a quick sell-off in prices when the bearish momentum picks up speed and overwhelms the buyers.
Profit Target
You can set your profit target based on Fibonacci levels or on previous support and resistance levels.
In general, you should aim for at least the next Fibonacci retracement level after confirming a downside breakout.
You may consider closing part of your position at each Fibonacci target to lock in profits while letting the remaining position run until you reach your final price target.
Stop Loss
A stop loss can be set on a percentage basis or at a fixed distance from the entry point depending on your own risk tolerance and trading objectives.
Make sure to test your risk management strategy on a demo account to ensure it works as intended and doesn't cost you money unnecessarily.
You can also trail your stop loss to breakeven once the trade is profitable to reduce your overall risk exposure and lock in profits sooner.
Double Top Pattern Rules
There are a couple of rules that you need to follow and apply to your analysis when trading the double top chart patterns:
- The leading trend: Do not trade double tops when you find them in a downtrend. You need to make sure that the price must trend upward leading to the pattern.
- Shape: You want to pay attention to the twin peaks. They should stand out individually and be relatively equal in height.
- Top Volume: An increased volume at the two tops is a sign of strength. You also want to see heavier volume on the first peak than on the second peak.
- Overall market trend: Ensure that you take the overall market trend into account as well. For better performance, you want to go short in a bear market.
- Confirmation: Don't short immediately once the breakout happens. You want to see a bearish candlestick form and close below the breakout point.
- Pullback: Don't worry when pullbacks happen. They often fuel the momentum for the bearish move.
To achieve your target profit, make sure that you have a proper risk management plan in place to limit your losses in case your trade doesn't work out as planned.
Risk management is an essential part of any trading strategy because it prevents you from making emotional decisions and helps you manage your risk effectively.
Keep in mind that there is always the chance that your trades won't go your way, and that's just part of the game.
So, you need to be prepared for the worst-case scenario by setting a stop-loss order in advance to avoid unnecessary losses if the market goes against you.
Performance Testing Results
I have done some performance tests to see how well the double top and bottom pattern strategy works in different market conditions and time frames.
My testing results on double top stocks and cryptocurrencies were impressive with an average win rate of around 70%.
In fact, I was able to reach my profit target over 75% of the time in bull markets, and around 62% in bear markets.
This excellent finding shows that this setup can perform well in different market conditions, and it can be used to trade any time frame from intraday to weekly charts.
Double Top Pattern Screener
A double top pattern scanner is a useful tool that can help you quickly find potential setups by scanning through thousands of symbols across various markets.
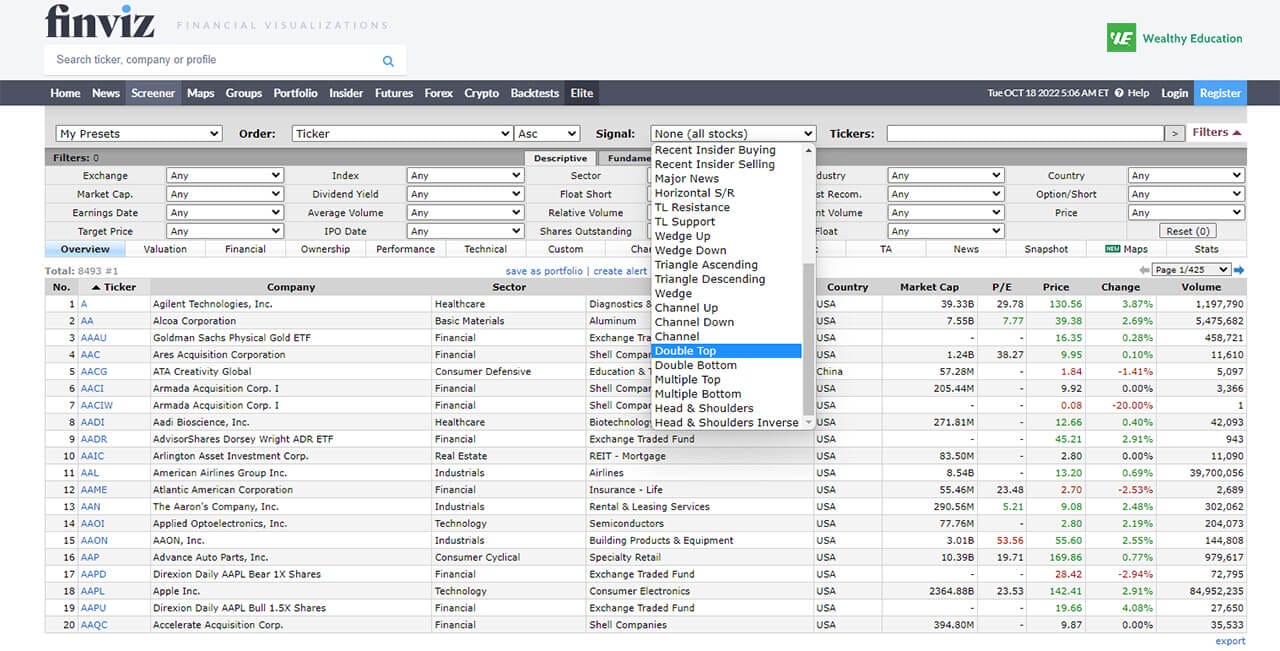
I personally use the Finviz stock screener to find double top formations in stocks on a daily basis, but you can also use other charting tools to perform the same task.
I find it to be one of the most reliable scanners out there, and its advanced features make it super easy to use as well.
The best part is that it's completely free to use. So you may want to give it a try if you're trading stocks or ETFs on a regular basis.
Final Words
There you have it - the most comprehensive guide on how to trade double top pattern and how to use it to boost your trading performance in no time.
In my experience, the double top and double bottom patterns work extremely well as a price reversal setup for both bull and bear markets.
However, you have to test this strategy yourself because only then, you will be able to know if it's suitable for your trading style or not.
Just remember to stick to the rules I have outlined here and to focus on the quality of the signals rather than the quantity.
As with other price reversal patterns, you have a better chance of spotting a successful trade if the setup is confirmed by multiple technical indicators.
This way, you will have more confidence in your trade and you will be able to minimize your risk exposure at the same time.
Finally, don't try to time the market because that will cause you to lose big in the long run. Instead, let the price action do the work for you and stay patient at all times.
If you find this article helpful, make sure you check out our chart patterns cheat sheet here to learn more about chart pattern analysis.
Good luck, and happy trading!

