Horn chart patterns can be a very powerful long-term trading strategy.
If you've never traded horns before, you might be thinking to yourself - "What is this all about?" And that's exactly why I wrote this article for you.
If you have been around the market for a while, you may have already heard of them, but you may not know exactly how they work.
The problem is, most traders don't know how to spot them, or how to use them to their advantage.
Trading horns can be challenging at first, but once you start trading them regularly, you'll develop your own trading strategy over time.
In this article, I'm going to teach you how to trade horns step by step. I'll walk you through every step of the process so that you can master this chart pattern.
Now let's get started....
What is a Horn Pattern?
A horn chart pattern is a short-term reversal pattern that signals a bullish or bearish trend change in a security's price movement.
This pattern is more of a candlestick formation than a typical chart pattern. That's because it's made up of just three candles: the horns and the middle candle.
The horns are created by two price spikes in the same direction of the current long-term trend, and a middle candle which closes between the two spikes.
The key characteristic of this pattern is that the two spikes must be above the surrounding price action, and be steeper than other price spikes.
The middle candle should be much smaller than the two outer candles, with a very small body. In addition, it must close between the twin peaks.
Volume tends to increase dramatically on the horn formation as well, which makes it easier to identify this pattern on a stock chart.
You can see horn patterns more frequently on long-term time frames, such as daily and weekly charts.
Horn Top Pattern
A horn top pattern is a short-term bearish reversal pattern that forms at the top of an uptrend and indicates an imminent reversal to the downside.
It's characterized by two upward price spikes embracing a small middle candle, followed by a swift and strong decline.
This decline often begins as soon as the market opens the following day after the formation of the horn tops.
This pattern is considered a mirror version of a double top pattern because both formations have twin peaks at the same price level.
You can imagine that the pattern looks like the horns of a bull: when prices go up quickly in an uptrend, and then suddenly reverse downwards.
It shows how traders react to the dramatic increase in volatility, and marks a pause in the bull market.
After the two price hikes occur, the bulls still cannot drive prices higher, so they decide to give up and sell their long positions.
This creates a strong barrier of resistance, and signals weakness in the market. Once the bears jump in, the market starts to fall sharply.
Example
The horn top formation is easy to spot if you know what you're looking for. Now let's have a look at an example of what it looks like on a trading chart.

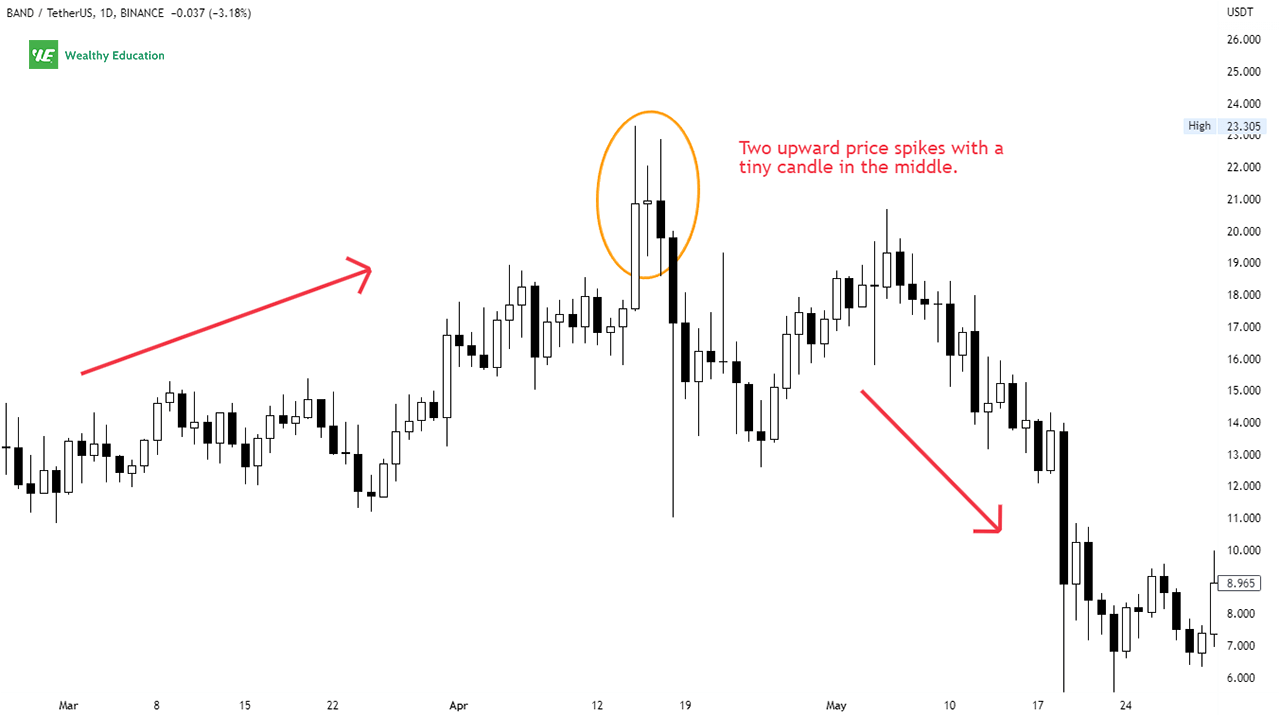
As you can see, Band Protocol (BAND/USDT) was in a strong uptrend until the middle of April, when it began to show weakness.
There was a sharp spike in volatility that pushed the markets upwards by over 32% within just a few hours.
Prices then moved lower, and it was followed by a second spike up. This price action created a horn top chart pattern on the chart above.
How to Trade a Horn Top Pattern
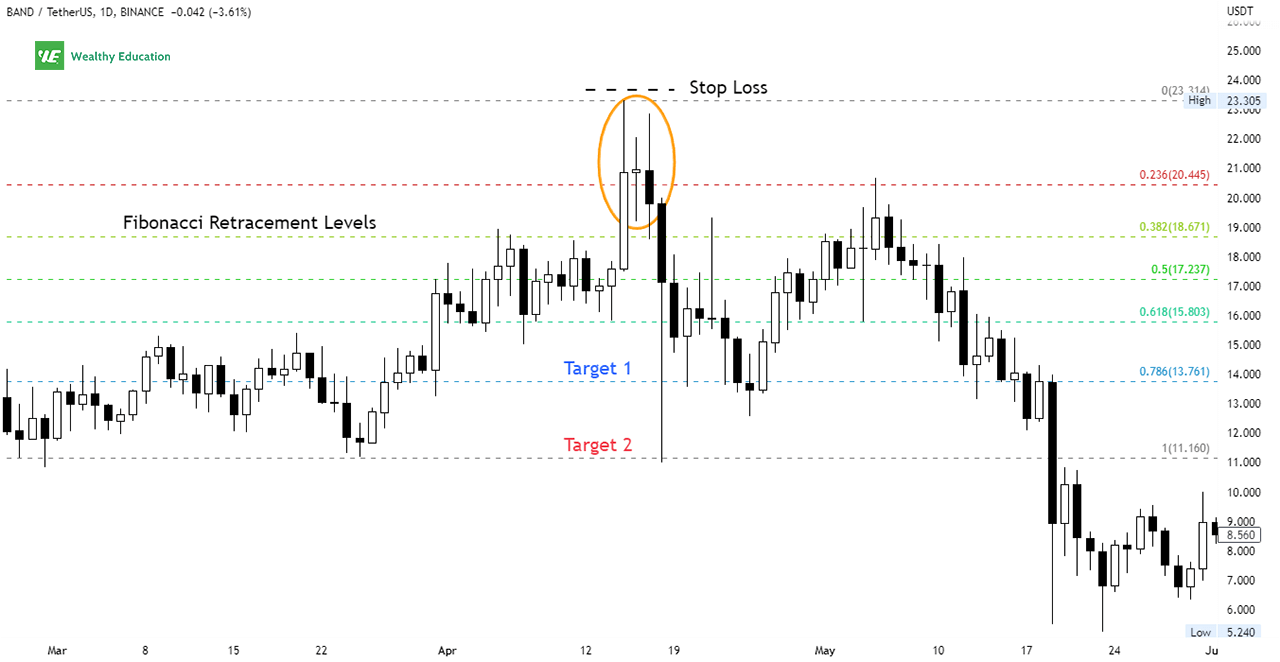
The horn top pattern trading strategy is simple. You can take advantage of the sharp reversal in price after the pattern formation is complete.

You can wait for prices to close below the lowest low of the spike candlesticks, and then enter a short position with a stop loss above the high of the right horn.
Your target price can be set based on market context, previous key support levels, or Fibonacci retracements.
Horn Bottom Pattern
A horn bottom pattern is a short-term bullish reversal pattern that occurs near the end of a downtrend and signals a potential upward trend reversal.
It's created by two downward spikes embracing a tiny middle candle, followed by a sharp rally.
This formation works exactly like the horn top stock pattern described above, except that the price breakout is upward.
It indicates an exhausted selling pressure in the market, as the bulls jump in aggressively to push prices higher.
In my experience, horn bottoms tend to perform better on longer time frames, and during a bear market.
An interesting fact about a horn bottom stock pattern is that it performs slightly better than a double bottom pattern.
Even though these two patterns look quite similar, horn formations have more closely spaced bottoms.
Example
A horn bottom formation is relatively rare, but when it appears on a chart, you can easily recognize it.
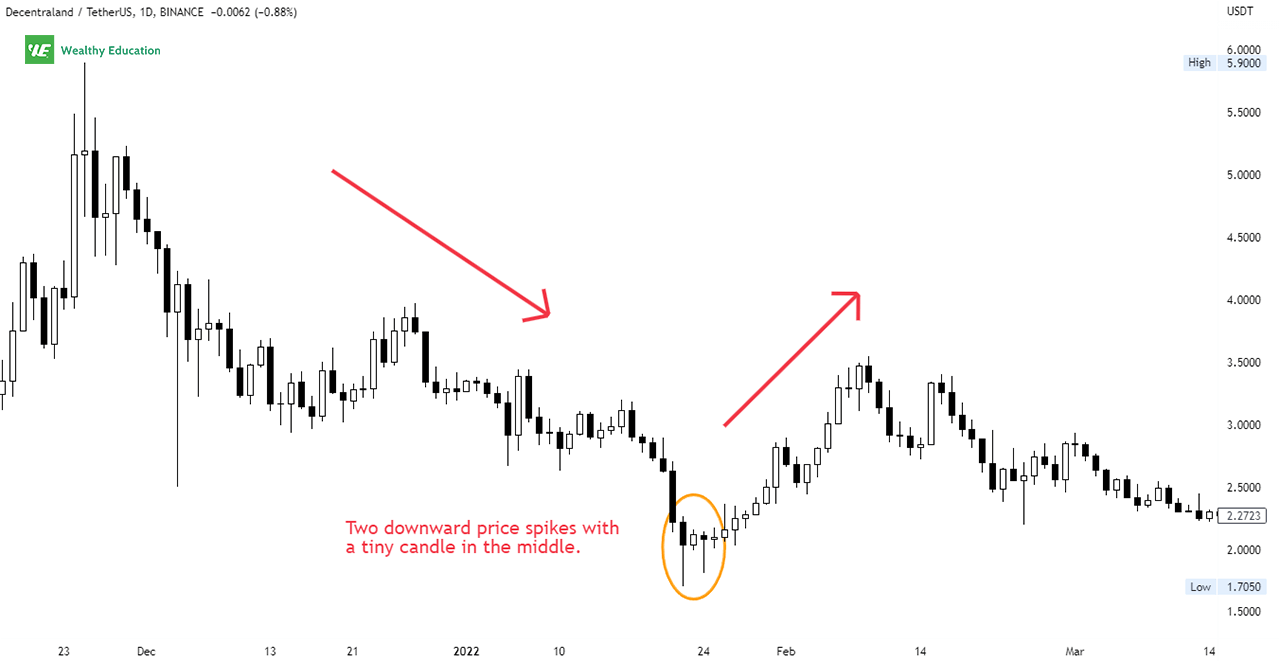
Let's take a look at an example from Decentraland (MANA/USDT).

As you can see, there was a strong downtrend until late January when the market started to show strength again.
Notice the three price bar formation. The two outer candles are the horns, and the middle candle is inside the trading range of the two horns.
The horn bottom chart pattern is complete when the price action closes above the highest high of the right horn.
How to Trade a Horn Bottom Pattern
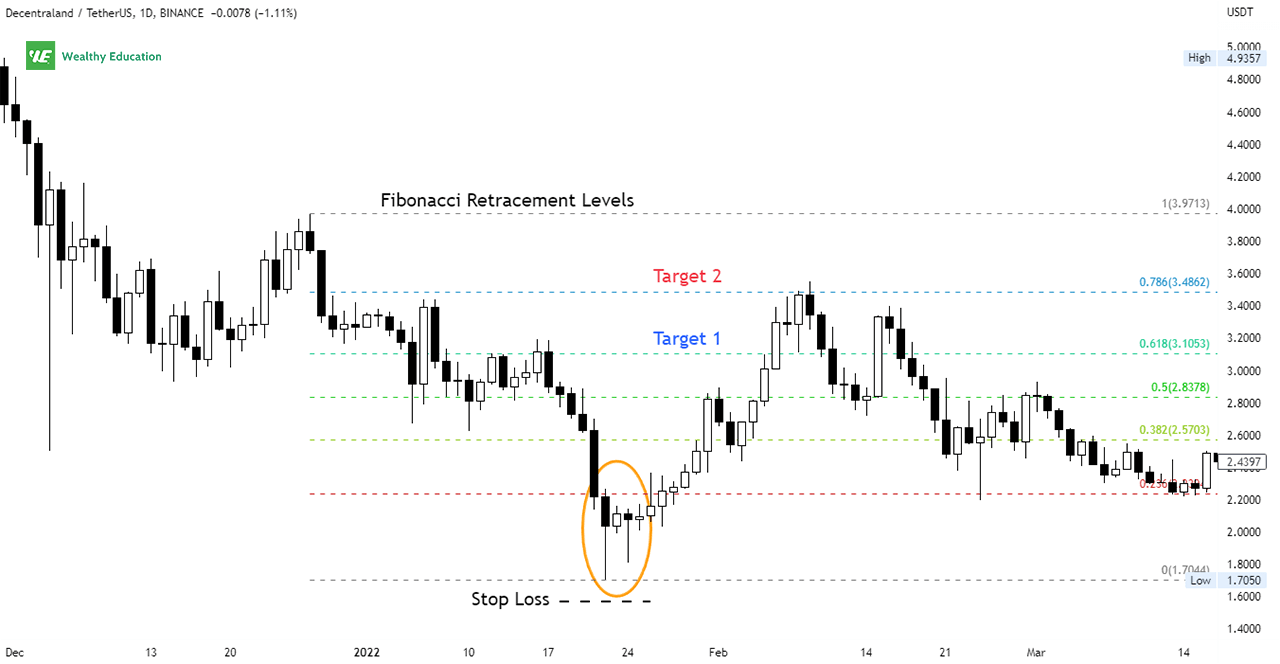
The horn bottom pattern trading strategy is easy to implement. All you need to do is wait for the price to break out above the formation.

An upward breakout with an increase in volume will help you confirm the bullish sentiment in the market, and you can place your orders accordingly.
When the breakout occurs, this is a buy signal. You can enter a long position and ride the market upwards to your target profit level.
You can set a price target using Fibonacci levels, or simply previous key resistance levels.
Don't forget to place a stop loss below the wick of the right horn candle to lower your risk exposure and avoid getting stopped out prematurely.
Horn Chart Pattern Trading Tips
The horn top and bottom pattern is a very profitable technical analysis setup that comes with a high win rate when you use it wisely.
Horn patterns are based on the idea that prices tend to rise or fall after reaching a certain price level twice in a row.
Therefore, the pattern allows you to identify buy or sell signals by looking at how the price action reacts to key support and resistance levels multiple times.
For example, in the case of horn bottoms, when the price fails to break the lower support twice, it shows that the support is too strong to break it any time soon.
When bearish momentum is exhausted, it's time for buyers to step in and take control of the market.
This results in an upward breakout after the horn pattern forms. It's as simple and profitable as that.
Here are a couple of things you need to take into account when trading this chart formation:
- Tall patterns tend to perform much better than short ones.
- Increased volume on breakouts leads to more reliable signals and increases your chances of hitting your profit targets.
- Formations with the right horn forming inside the left horn's trading range (left spike) work better in terms of performance.
- Throwbacks really hurt performance and tend to stop the pattern from completing itself successfully.
As with other chart patterns, you must wait for confirmation before entering the market.
The pattern is valid when a breakout occurs, and price closes either below or above the right horn candle's wick, depending on whether you're bearish or bullish on the market respectively.
You can use other technical indicators to confirm the strength of the breakout before placing your orders. These include candlestick patterns, RSI, and moving averages.
Also, keep an eye on trading volumes to spot potential changes in buying and selling pressure before making your trading decision.
Summary
Both horn top and bottom formations provide a clear signal for traders to identify the trend who know how to spot them.
No matter which strategy you choose, the important thing to remember is that you need to find your entries properly.
When it comes to trading the horn patterns, it's best to wait for price to break out of the formation before taking any position.
That way, you can increase your odds of catching a big move and maximize your profits at the same time.
However, sometimes it's better to enter the trade immediately as the momentum is strong, but make sure you set a clear stop loss so that you don't risk too much.
So be careful and be smart when it comes to setting your entry points. Don't trade impulsively.
As always, practice makes perfect. I hope this article helps you get an edge in the market and become a more profitable trader in the long run.

