You've been playing with the market all day long, but when the price takes a dive like a bump and run, you know you need to sell... but you don't know how.
You can't expect the market to rise forever... And the longer you hold, the higher the probability of a trend change.
The problem is, most traders never fully understand this, and they continue to chase losses indefinitely.
The bump-and-run reversal is a pattern I see ALL THE TIME, but the only way to master it is through repetition and practice.
In this article, I'll teach you a powerful chart pattern technique that focuses on selling when the price action hits the edge of support and resistance.
The strategy I'm going to show you is rather simple, and it gets straight to the point - there's not much to it.
If you've always wanted to master the BARR pattern, then this article is for you!
Now let's jump right into it...
What is a Bump and Run Pattern?
The bump and run reversal pattern (BARR), discovered by Thomas Bulkowski, is formed when there is a sharp rise or fall in the price of an asset due to excessive speculation and volume spike.
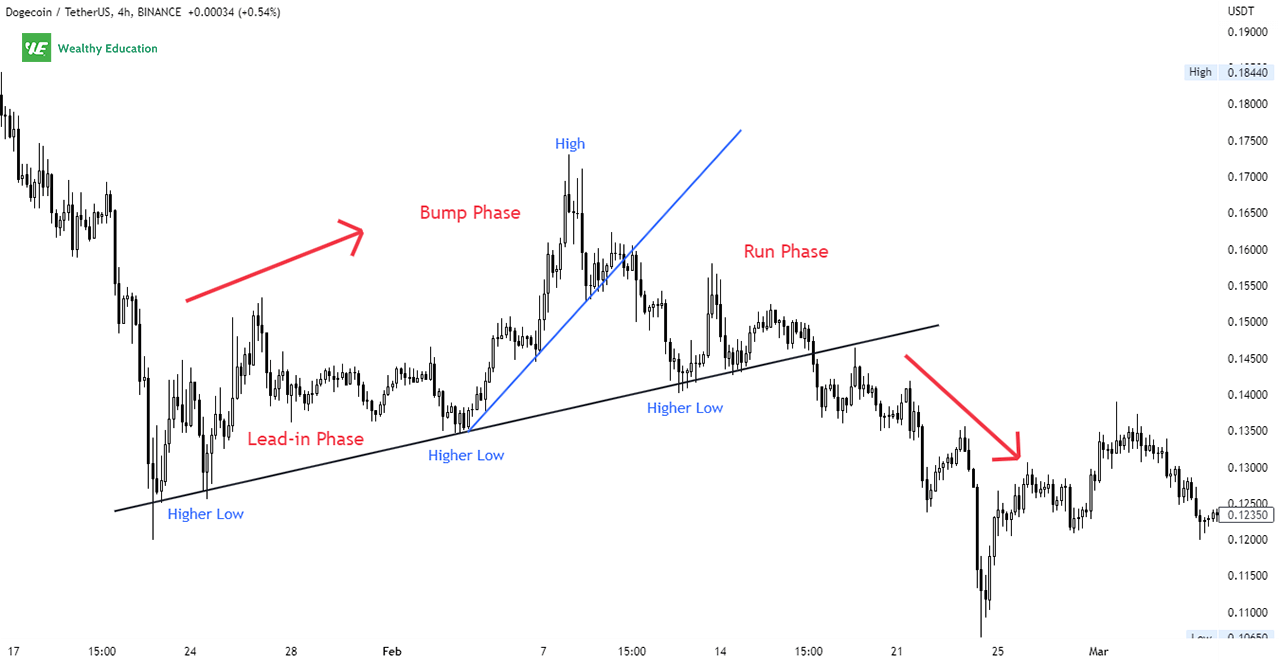
There are three phases during the formation: the lead-in, the bump, and the run.
The idea behind this pattern is that after a sharp move in one direction, the price will make a short-term retracement back to a key level of support or resistance.
Bump-and-run patterns are often caused by volume spikes, insider buying, or technical indicators.
You can make a lot of quick profits if you can spot them and time your entry correctly.
The key to trading this formation is finding an entry point once the run phase begins.
When the price breaks the lead-in trendline, you can consider entering the market.
Your target profit is the bump height and your stop loss is set based on your risk tolerance.
Is a Bump and Run Bullish or Bearish?
Yes, the bump and run bottom pattern is a bullish signal because it leads to a strong rally after a steep decline.
The formation is considered complete when the price breaks up through the resistance from the signal line.
It's worth noticing that there are two variations of this pattern: one is trending up, one is trending down.
We'll dive into each one later in the next section.
Formation
How the bump and run chart pattern works is simple:
- There is a steady move up (or down) in the market.
- The price suddenly rises (or falls) due to a spike in volume.
- The price then quickly reverses direction and bounces back to its starting point (the run).
This pattern is made up of three phases: the lead-in, the bump and the run.
Lead-in Phase
The first part of the bump-and-run chart pattern is the lead-in phase. It occurs when there's a steady price rise, with no excess speculation.
This phase can take 1 month or even longer to form the basis from which we can draw a trend line.
The trend line should be sloping upward at about 30 to 45 degrees to create a valid bump and run trading pattern.
The lead-in trend line acts as a support or resistance level depending on the market.
It is also used to determine your entry point into the market once it reverses direction in the run-up phase.
Bump Phase
The bump phase starts with a spike up (or down) in price due to a surge in speculative activity.
The trend line angle will depend on the scaling (arithmetic or semi-log) and the size of the pattern.
Roughly speaking, it can reach somewhere between 45 and 60 degrees.
This can happen due to a number of things, such as an influx of buying or selling, breaking news, or simply a sudden change in fundamentals.
As the run-up continues, more and more traders enter the market and hence the price keeps rising (or falling) further.
This phase can continue for anywhere from a few days to a few weeks depending on the market and its momentum.
If the price advance is not steep enough to make a new high, the price action will create a double top pattern.
Engaging in the run-up phase is risky because of its highly speculative nature.
But it can also yield quick profits if you can enter the market at the right time and get out before the trend reverses again.
Run Phase
The final phase begins when the price retraces back to the key level of support or resistance.
This level can be anything from the signal line, a moving average to a Fibonacci level.
The bearish reversal occurs as the price drops below the support line.
In the bullish case, the reversal happens as price breaks above the resistance from the trend line.
Prices often bounce off this level at least twice before continuing in the direction of the trend.
The formation is validated when the breakout finally goes through.
Bump and Run Reversal Top Pattern
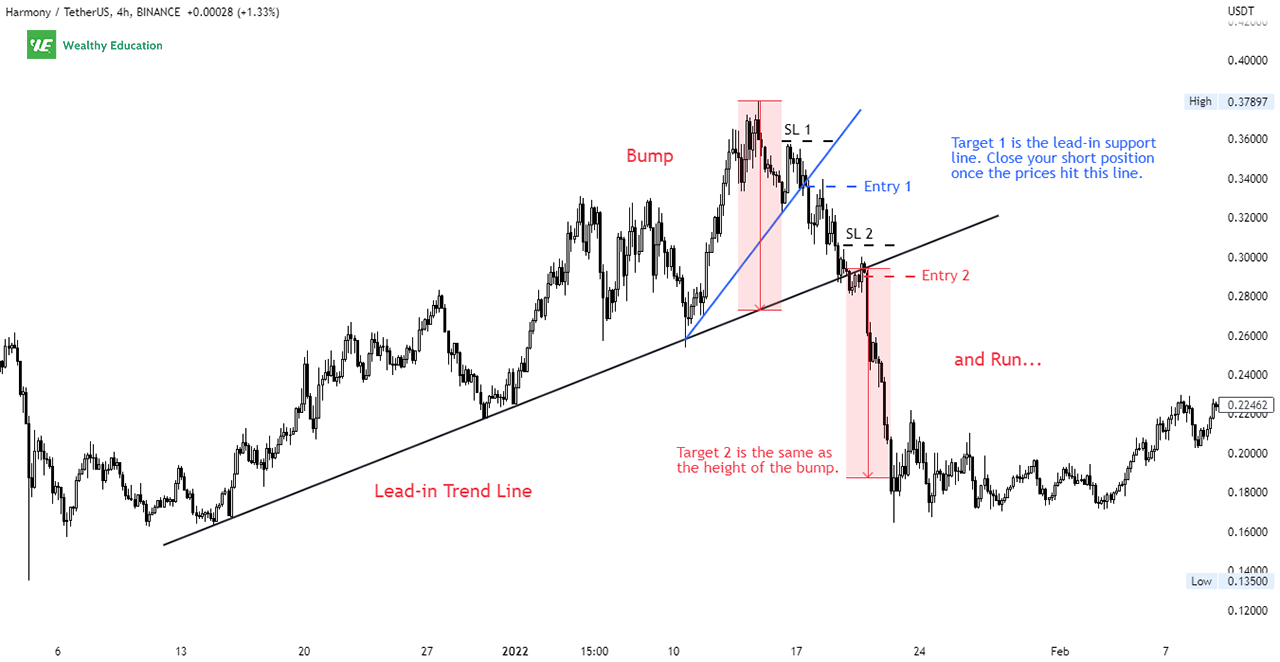
The bump and run reversal top is a bearish reversal pattern that is characterized by a sharp price rise during an uptrend, followed by a sudden price decline towards the previous support level.
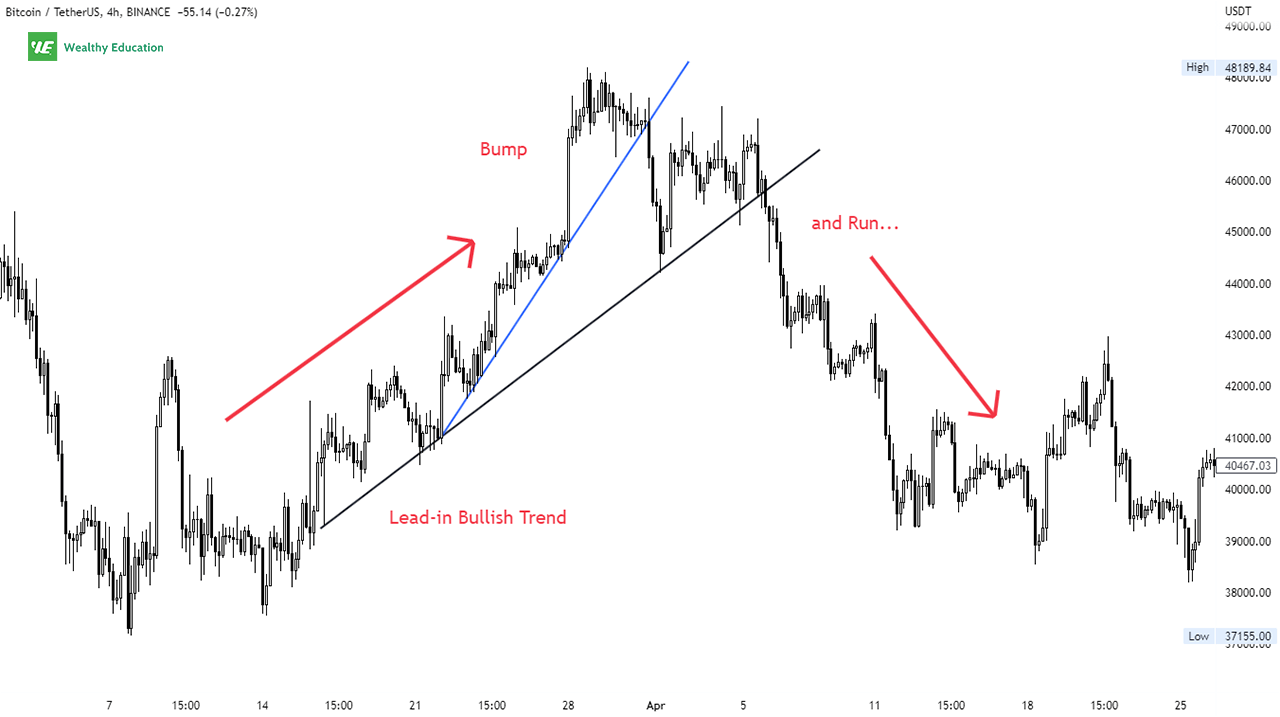
Prices close below the lead-in line confirm the bearish trend. Therefore, you should always wait for the market to break below this line, and then look for a short entry.
Your target profit should be the same height as the bump, which is the distance from the trend line to the top of the bump.
Bump and Run Reversal Bottom Pattern
The bump-and-run reversal bottom is a bullish reversal pattern that begins with a series of descending peaks.
Excessive speculation drives prices down until reaching extreme lows.
The price action then reverses direction to the upside and marks the end of the downtrend.
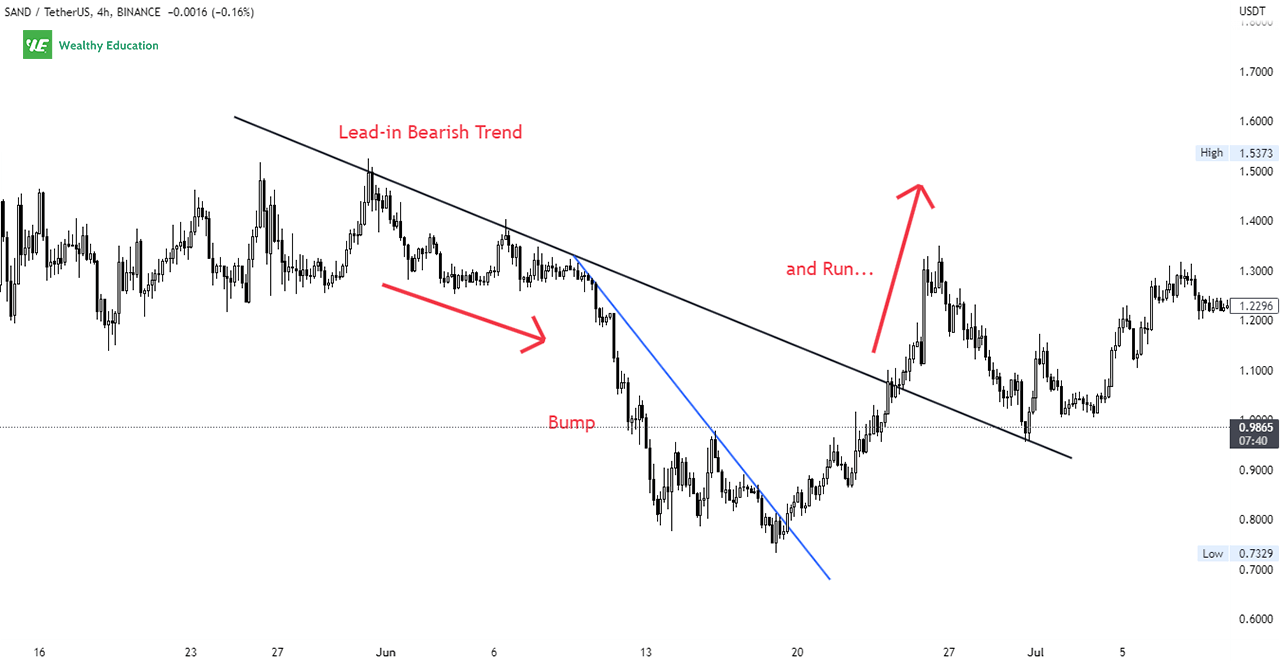
You can look for a buy setup when volume expands and an upward breakout occurs. The price target is also the height of the bump.
Keep in mind that prices must close above the lead-in line to confirm the price trend.
There will be some retracements, so make sure that you don't get in too early. You may end up getting caught in a false move and getting stopped out.
Example
The bump and run reversal chart pattern is quite easy to spot on a chart. As you can see, it looks exactly like a frying pan.
The first thing you'll notice is the pattern starts with a moderately steep rise to the highest high.
Then you'll see a pullback to a previous support area, which marks the low of the bump.
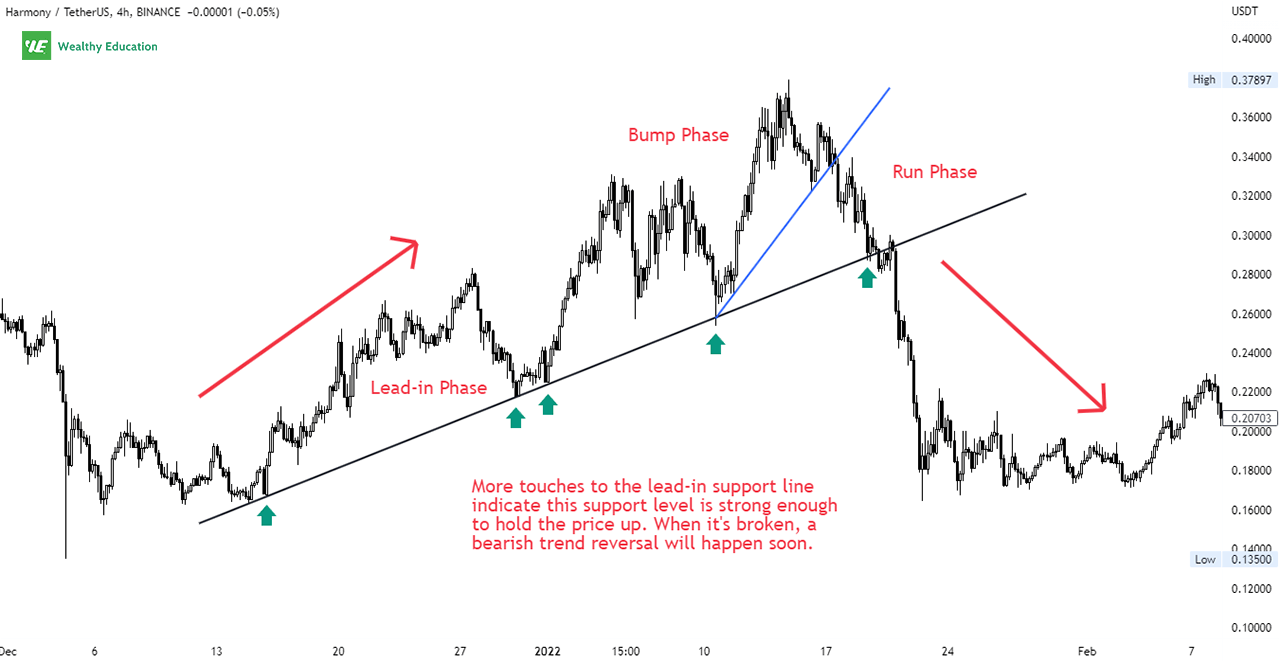
Volume is usually high during the bump phase. The price may bounce off the trend line a few times before finally breaking through it.
More touches to the lead-in support line indicate the bulls are trying to push the price back up again.
But when it's broken, it means the bears have won the battle and the trend will likely reverse to the downside.
This subsequent trend line break indicates a strong sell signal. Prices begin to drop further as more and more sellers are coming in to short the market.
Trading Strategy
There are a few different ways to make money off bump and run formations (BARF), but the best way is to wait until the market breaks the signal line and then trade the direction of the trend.
The target for this pattern can be found by measuring the height of the bump and adding it to the breakout point.
If you love trading this formation, you need to be able to see when the trend changes. That's why you need to pay close attention to the changes in volume.
If you see an increase in volume on the upswing, you know that traders are piling into the market to drive prices up too far.
That's a clear signal that the trend is changing, and it's time for you to look for a profitable entry. Just be a smart trader!
It is important to keep in mind that the market can remain in a consolidation period for an extended period of time before finally breaking out.
Therefore, you'll need to be patient and wait for the market to retrace a little before taking any position.
The Bottom Line
Trading this pattern is super easy; it's just a matter of knowing when to enter and exit the market.
If you're still learning the ropes, this is a pattern you need to master ASAP because you can use it on multiple occasions.
Remember, the market is always changing and nothing is ever 100% certain.
Please make sure you use these BARF in conjunction with other technical indicators and bullish chart patterns to paint a clearer picture of the upcoming market directions.

