If you have been trading the rounding top pattern, you know that it can be sweet and very profitable.
However, since the market rarely follows the textbook definition, it's very important that you learn how to spot this technical pattern on your own.
In this comprehensive guide, I'm going to teach you how to identify rounding tops, and how to trade them for maximum profits.
You'll learn exactly how to pick your entry and exit points every time, and how to avoid the common pitfalls that lead to losing trades.
I'm not going to waste your time with a bunch of "fluff" that you'll never use in your trading.
So without further delay, let's jump right into it.
What is a Rounding Top Pattern?
A rounding top pattern is a long-term bearish reversal pattern that appears at the end of a bullish trend.
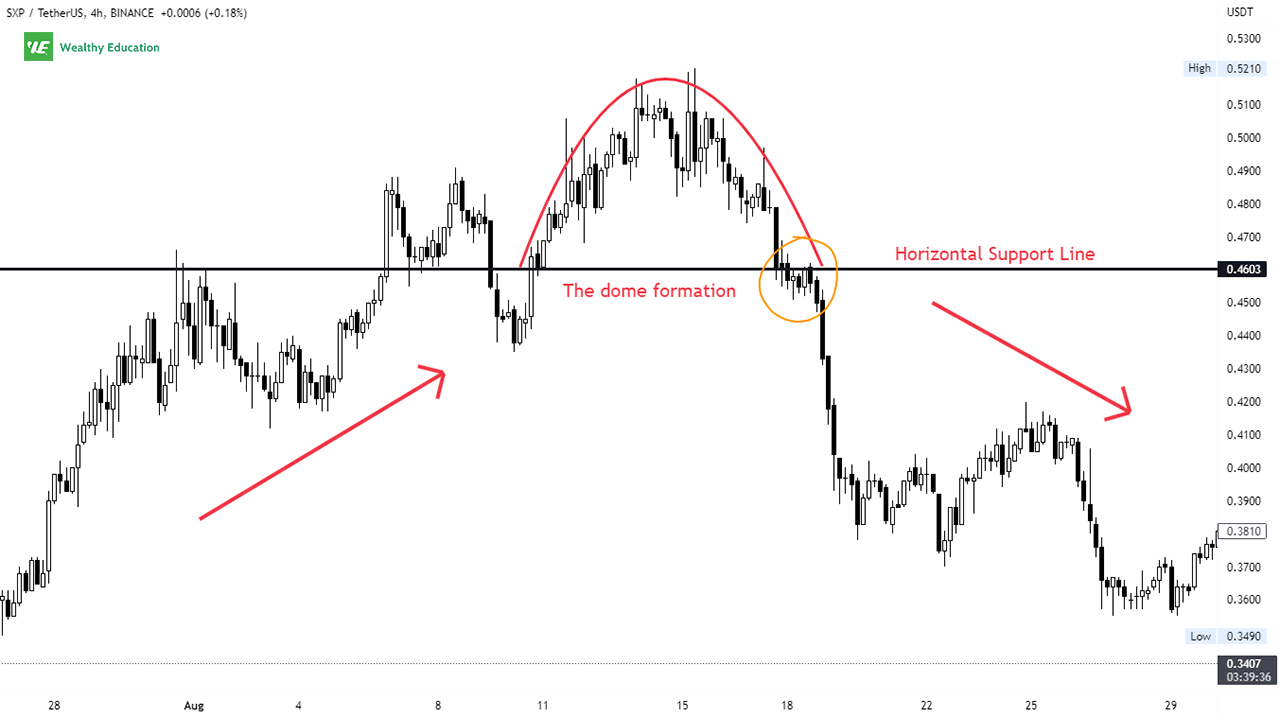
It is formed when prices begin to slow down and round off at the top of an uptrend. This makes the formation look like the shape of a dome or rounded hill.
As this occurs, prices keep going lower and lower following a downward sloping curve until they finally retrace back to the bottom of the formation or the base of the dome.
This pattern indicates a gradual decrease in bullish momentum and a weakening of the prior uptrend.
It implies that buyers are running out of steam as sellers become more and more dominant in the market.
This causes the market to head down to the previous support level, and break below it if the selling pressure is strong enough.
A downward breakout occurs when prices break down through the support trendline (or the neckline), marking the end of the previous uptrend.
The breakdown is confirmed when the breakout candle closes below the bottom trendline.
The rounding top stock pattern is also referred to as an inverse saucer pattern. Sometimes it leads to an inverse cup and handle formation when prices hit the support level and bounce back up.
Rounded Top Formation
The rounded top formation is a technical analysis indicator that occurs frequently in financial markets, especially near the end of a prolonged uptrend.
It attracts a lot of attention from traders because they see it as a sign of weakness in the bull market, and a potential bearish trend reversal signal.
The rounding top reversal pattern is characterized by a rounded half-moon shape, followed by a sharp decline to the downside.
It may take several weeks or even months to fully complete the formation, depending on the strength of the prevailing trend, and the volatility of the market.

When looking for this setup, you'll need to pay attention to the smoothness of price action during the rise.
The price should move smoothly in a curve manner, without experiencing any significant dips or spikes along the way.
That's to say, the price should make a gentle rounding turn, forming an inverted U shape on the price chart.
When the market is highly volatile, the upward move may not be as smooth as usual.
As a result, prices tend to move in erratic spikes and pierce the top temporarily, hence creating a V shape instead.
But this is acceptable as long as the overall price movement is still in a curve-like manner.
You should also take trading volume into consideration when determining the validity of this pattern.
In my experience, rounding top and rounding bottom patterns often come with a bowl-shaped volume trend, with the lowest volume occurring at the center of the pattern, and a high volume spike at the reversal point.
Now let's take a quick example of a rounding top reversal pattern, so you know exactly how to identify it on trading charts.
Example
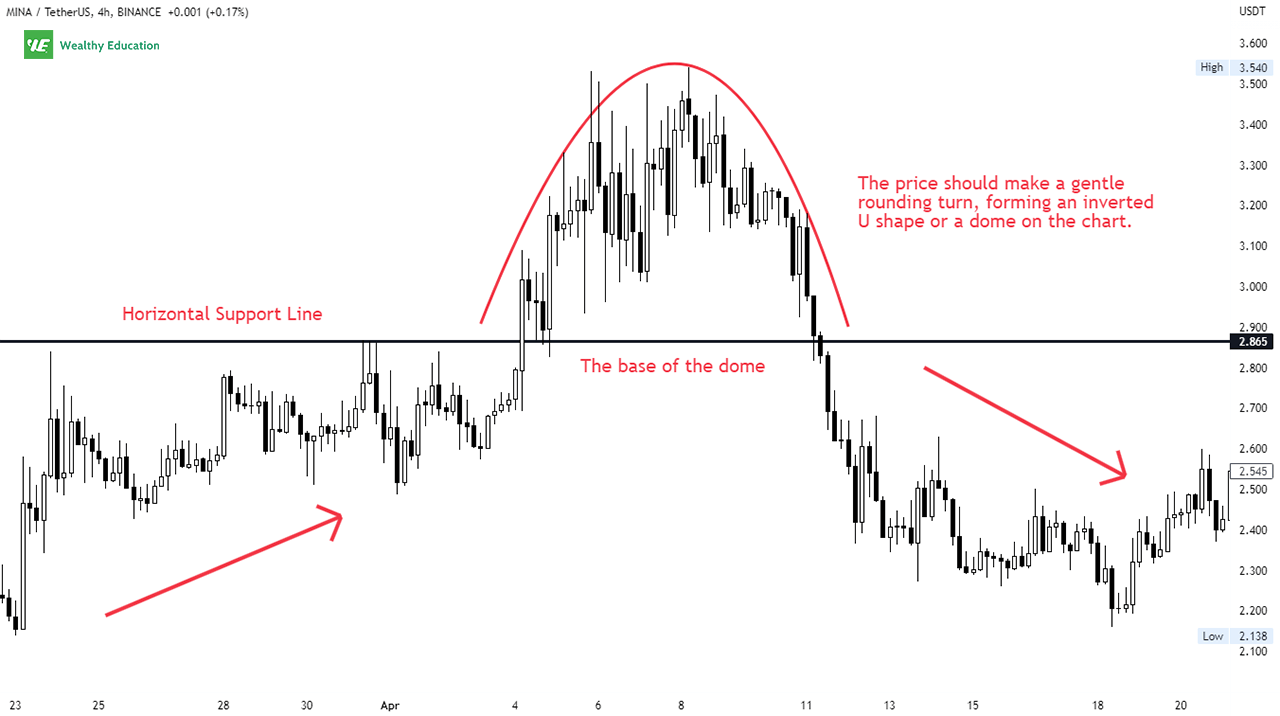
The example I'm going to show you is the Mina Protocol (MINA/USDT) chart on the 4-hour time frame.
First of all, you'll need to draw the rounding top using a simple trend line tool on the graph.
You can see that it looks like a rounded half-moon or a dome, or whatever you call it. The point is the same - it's an inverted U shape with a downward sloping curve at the end.
Then, you'll need to draw a horizontal trendline connecting the left and right rims to create a support level. This trendline is referred to as the neckline of the rounded top pattern.

As you can see, the price action which occurred in the first two weeks of April looks exactly like a mirror image of what we just talked about.
During this uptrend, the price action made a gradual curve-like move upwards in a pretty smooth manner. This created an upside-down U shape on the chart.
You can see the shape of the rounding top chart pattern was easily recognizable. It started and ended at the same price level, which in this case was $2.865.
This pattern marked the end of the bullish trend and provided a good entry point for taking a short position.
How to Trade Rounding Tops
The rounding top pattern trading strategy is easy to trade once you get the hang of it.
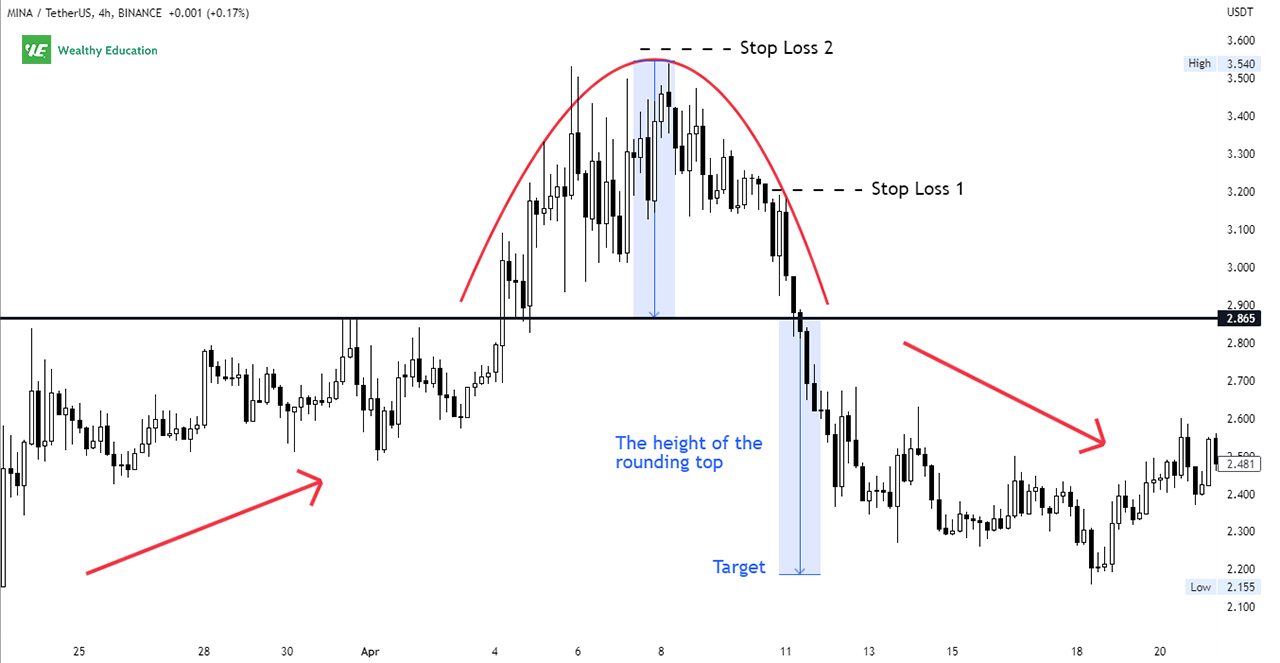
You just need to wait patiently until the price breaks below the neckline of the rounded top pattern.
When this happens, you can initiate a short position and ride the wave all the way down.
You can place a stop loss slightly above a recent high, or above the highest high of the pattern to protect your account in case the market moves against you.

Similar to the rounding bottom chart pattern, your profit target can be either the height of the actual pattern or Fibonacci retracement levels.
You may consider taking a smaller profit if the market doesn't seem to move any closer to your price target.
If the price drops sharply below the neckline, then your short position will be profitable very quickly.
But if it slides gently down the support line, you should be wary because this may be a fakeout and the trend may resume soon.
So you'll want to wait for a second confirmation before pulling the trigger on your short trade.
In this case, you want to see a bearish candlestick form right at the reversal point to confirm that you're on the right track.
Alternatively, you can use other technical indicators to confirm the bearish momentum and market sentiment, such as Stochastic or MACD.
For example, you can look for a divergence between the price and the momentum indicator that you're using.
In my experience, the downtrend signal is better if volume spikes when the breakdown occurs.
This indicates selling pressure is strong in the market at the moment, and chances are high that the price will drop further.
However, that's not always the case. Sometimes, you won't see a volume spike, but the pattern will still work as expected.
So you should only use this as further confirmation, and not treat it as a hard-and-fast rule for trading this pattern.
Bullish Rounding Top Pattern
You may be wondering if the rounding top chart pattern can be bullish. Well, the answer is "yes" if you view it as a short-term continuation pattern.
This happens when the price action bounces off the support trendline and starts climbing higher again to the previous highs.
It eventually breaks above the top of the rounding formation, and an upward breakout confirms the continuation of the preceding uptrend.
This pattern takes place when traders are unsure of where the overall market is headed next.
So the market bounces back and forth within the dome shape for a while before a breakout occurs.
In my opinion, the bullish rounding top formation is not a reliable trading signal on its own though.
That's because, most of the time, you'll see the breakout direction is downward instead of upward.
However, every scenario is possible in the financial market - so make sure you'll always wait for confirmation before entering your trade.
Rounding Top Screener
Using a rounding top pattern scanner will tell you exactly where the pattern is present on the chart.
You can set the parameters and let the scanner do all the work for you. Simply set the pattern type to "Rounded Top" and you're good to go.
However, I do not recommend using any screeners as no algorithm can accurately predict the direction of future prices 100% of the time.
In my experience, there are a lot of false signals on the screeners that I tried out in the past - so be careful when using these.
And if you're new to technical analysis, it's a great way to get started by learning how to identify price patterns by yourself.
You'll learn by trial and error along the way and eventually master it when you practice enough.
Backtesting Results
The first thing you need to keep in mind, when trading rounding top and bottom patterns, is that breakout direction can be both up and down.
That's to say, you always need to wait for confirmation before taking any position on the market.
This is important because you don't want to place a trade in the wrong direction or risk too much on a trade that's not likely to work out in your favor.
From my standpoint, I'd wait until I see clear evidence supporting the rounding top breakout before placing my orders - for example, an RSI divergence or a bearish candlestick.
You should also pay attention to the size of the formation. After many backtest on historical data, I've found that it's more effective to trade the taller formations compared to the short ones.
In addition, narrow patterns tend to perform much better than wide ones. I also found that patterns with a U-shaped volume provide stronger signals.
This applies to all market conditions, timeframes, and breakout directions. That's why I always look for tall and narrow formations to trade.
But just like everything else in financial markets, there's no perfect strategy that works for all situations - so you'll have to test and tweak things until you get the results you're looking for.
Trading Tips
Trading rounded tops can be a great way to profit from market fluctuations as long as you remember to wait for confirmation before entering a trade.
They're fairly easy to spot on the charts, but you have to remember that not every pattern will turn out in your favor.
So be careful and patient when trading them - and remember to practice risk management.
Make sure you always have a trading plan to keep you focused and avoid emotional decisions that can negatively impact your account.
Don't forget to place a stop loss order to protect your capital and minimize your losses in case things don't go your way.
When the market moves in your favor, you can consider locking in some profits before riding the trend higher.
Remember that a bird in the hand is worth two in the bush. You don't know what will happen next, so taking some off the table now is better than risking it all later.
The key to success as a trader is learning from your mistakes and not repeating them over and over again.
And the only way to do that is by practicing and consistently improving your skills over time.
The Bottom Line
There you have it - a comprehensive guide on how to trade the rounded top chart pattern.
Here are my best rounding top tips for you:
- Be patient and wait for clear signals before you place any trades
- Avoid trading breakouts with mixed volumes
- Look for tall patterns and narrow formations
- Trade with the trend and not against it
- Use stop loss
Make sure that you always wait for the right setup to enter the market - otherwise, you're risking too much unnecessarily.
Rounding tops are characterized by their inverted U-shaped appearance, followed by a strong reversal to the downside.
The price moves up from the neckline in a curve manner and makes a sharp U-turn that marks the end of an existing uptrend.
The price action should be smooth and gradual, without showing any unusual spikes along the way.
This makes it a lot easier to spot than other chart patterns like a head and shoulders or a triple top pattern.
You can look for a short trade setup when prices reach the bottom of the formation and break down through its neckline.
It's important that you learn how to identify when a stock is forming rounding patterns to time your trades accordingly.
After all, you don't want to miss out on the best opportunities in the market.
So get familiar with this technical chart pattern and master it until you start seeing profits in your account.

