If you see a rectangle bottom pattern on your chart, you’re probably wondering "How can I trade this chart pattern?"
Well, trading rectangle bottoms can be difficult if you don't have enough understanding of how they work, and where they come from.
I've been trading this chart formation lately, and it's been a lot of fun. However, it's quite challenging to execute the trades.
That's why I want to show you how I do it. If you're new to rectangles, and want to learn how to trade them correctly, then this article is for you.
Now, let's jump right into it...
What is a Rectangle Bottom Pattern?
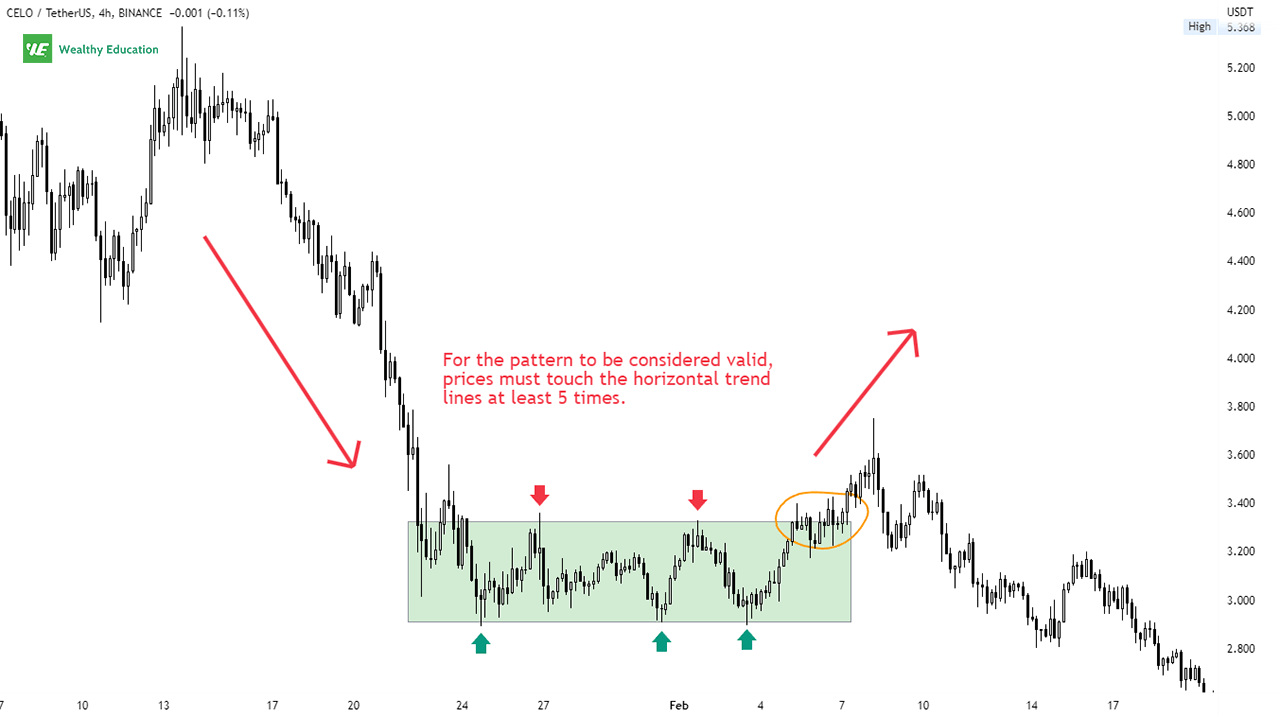
A rectangle bottom pattern is a bullish reversal pattern that appears at the bottom of a financial market. If it appears in the middle of a downtrend, it may serve as a bearish continuation pattern.
It's characterized by a long downtrend, followed by a period of consolidation, and then a short-term reversal to the upside.
This pattern is formed when the price consolidates in a rectangular trading range before breaking out above the upper resistance level, and rising higher.
By connecting minor highs and lows of the rectangle with two horizontal trendlines, you'll create a box-like formation that resembles a sideways horizontal channel.
These trendlines are key support and resistance levels where the price frequently bounces off during the consolidation period.
This consolidation phase often comes with low volatility and indecision from traders. It shows that the previous downtrend has been somewhat exhausted.
During this time, traders don't want to commit too much capital to the market, until there are signs that the uptrend will continue.
The rectangle bottom stock pattern is also referred to as a bullish rectangle pattern, or a horizontal channel bottom.
Bullish Rectangle Formation
The bullish rectangle chart pattern is created by two horizontal trend lines drawn across a series of price peaks and valleys that form a rectangle shape on a stock chart.
You can see this formation appear during a down trending market, followed by a sideways or consolidation period.

The price action is likely to bounce between two parallel trendlines for a few days before breaking out.
The lower trendline acts as a support level (also called a base), and the upper trendline acts as resistance.
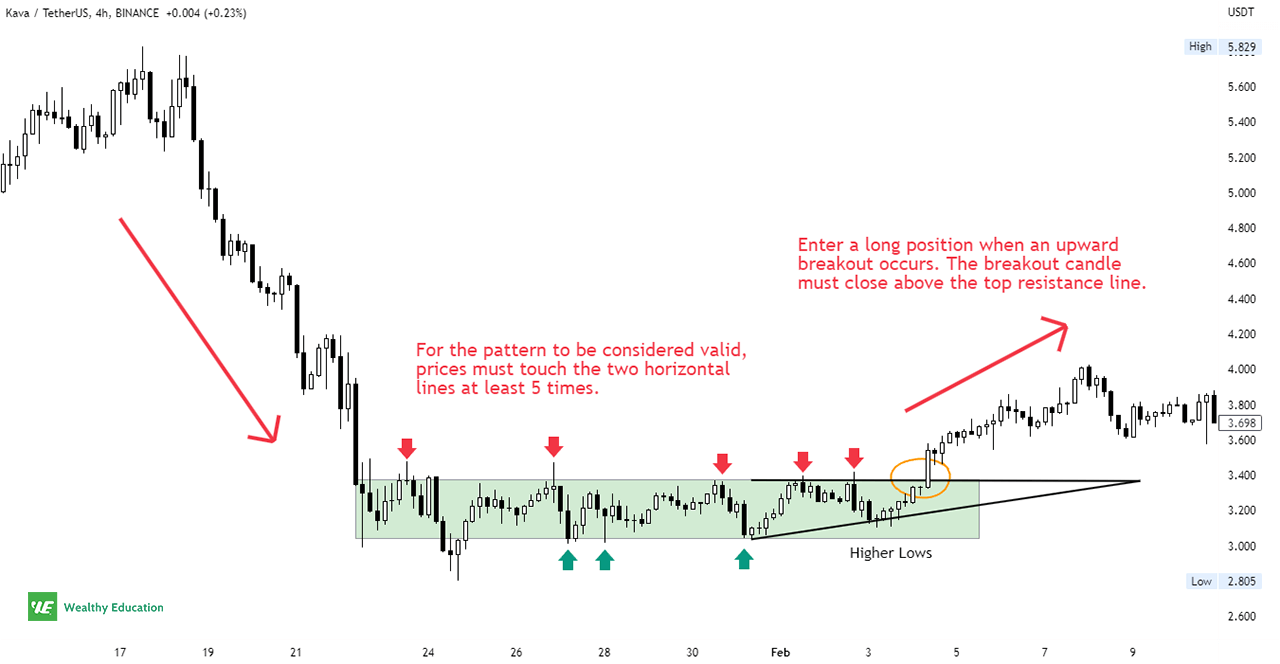
If you see the price break up through the resistance line, you can consider this a buy signal for a short-term upward move.
The reversal usually begins when the price action bounces off the support level, and creates a series of higher lows that looks like an ascending triangle formation.
For the rectangle bottom formation to be considered valid, prices must touch the boundary lines at least 5 times.
In addition, prices must stay within the two parallel trendlines until an upward breakout occurs that marks the end of the prior downtrend.
You should also take trading volume into account as it tells you exactly what's going on with the market sentiment and the current trend strength.
As this pattern represents an exhaustion of the trend, you'll see that volume tends to diminish throughout the formation of the rectangle.
You may see increasing volume on the breakout day, indicating that buyers are taking control of the market and driving prices higher.
Now let's have a look at a quick example of a rectangle formation.
Example
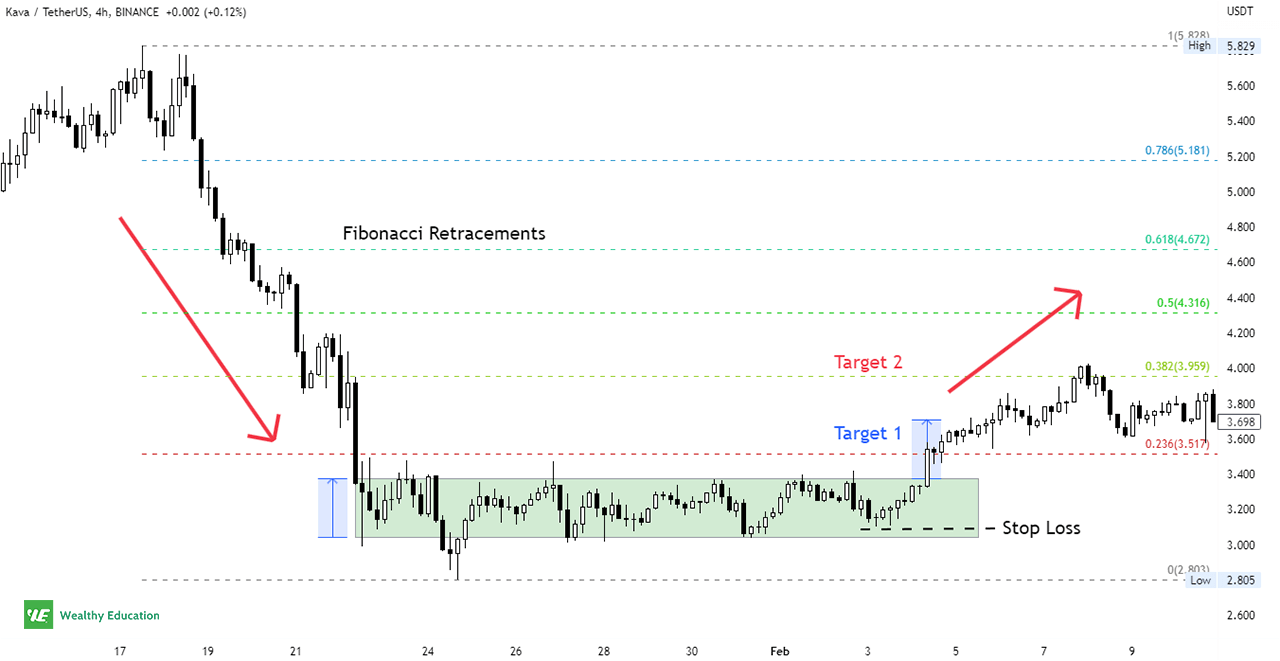
As you can see on the figure below, Kava Network (KAVA/USDT) formed a rectangle chart pattern after a prolonged downtrend. Prices dropped from $5.829 to $2.805.

The pattern started with a strong downtrend, followed by a consolidation period, and then a strong rally to around $4.001.
You can see that prices bounced between the upper and lower trend lines, and touched these support and resistance lines multiple times before breaking upwards.
The formation was considered complete when prices broke above the upper resistance line, showing a clear reversal of the downtrend.
How to Trade a Rectangle Bottom Chart Pattern
The rectangle bottom trading strategy is simple to implement, but does require patience as the pattern can take anywhere from a few days to a few weeks to complete.
All you need to do is to wait for the price to break above the top boundary line, and then enter a long position.

Similar to the rectangle top pattern, your price target for the bottom formation can be the height of the rectangle.
You can also set your target profit set based on Fibonacci levels, or previous key resistance levels.
However, it's best to wait and see what happens after the breakout day before placing a target on your trade.
If the rectangle is short, you can set a stop loss below it. However, if the pattern is tall, you can place your stop loss just below the recent low.
Either way, placing a stop loss will help you limit your risk exposure, and keep your losses to a minimum.
In my experience, a pullback may happen after the upward breakout occurs, so you'll need to prepare for that probability.
The price may pull back down to retest the resistance level before pushing higher again, so make sure you don't get in too early.
The best way to trade the rectangle bottom pattern is to buy when a breakout candle closes above the top trendline, or after a pullback happens.
This way, you can increase your chances of catching a nice upward move once price breaks out from the pattern.
Double Bottom vs Rectangle Pattern
Rectangle patterns sometimes look identical to a double bottom or triple bottom pattern, so it may be hard for you to distinguish them from one another visually.
The easiest way to identify them is to look at trading volume.
Normally, you will see a surge in volume on the breakout phase of the double bottom, whereas there is no significant volume on the breakout of a rectangle formation.
However, you don't need to worry much about that, as they both tell you the same thing - the market will reverse to the upside.
Trading Rules
There are a few trading rules that you should follow while trading the bullish rectangle pattern.
Following these rules will allow you to achieve more profits in the long run:
1. You don't want to trade a sideways market
If you find yourself in a sideways market, you're better off waiting for an upward movement to occur before going long the market.
Trading sideways markets is a good way to lose money. Don't make this mistake, otherwise this will cost you an arm and a leg!
That's because there's no clear direction in which way the market will move next. You'll end up losing money as you buy into a weak market and sell into a stronger one.
2. You want a confirmation before taking any position
The market needs to confirm a potential reversal before you can enter a trade, otherwise you'll end up on the wrong side of the market.
While it's common for traders to ignore this rule, you'll do well if you follow it closely. This will prevent unnecessary losses from affecting your account negatively.
You want to see a bullish reversal candlestick pattern establish right above the breakout of the rectangle. This gives you another bullish reversal signal.
Make sure that you'll only enter a trade when prices close above the top trend line of the rectangle, or after the pullback happens and prices stay above that trend line.
3. Don't get greedy
The most common mistake that novice traders make is that they get too greedy and try to increase their position size while the price is moving higher.
Trust me, this is a big mistake. This will let your greed take over your emotions.
You need to keep your position size at an acceptable level, and follow proper risk management rules if you want to succeed as a trader in the long run.
Otherwise, you'll end up losing a lot of money along the way. Even if you win some trades initially, you won't make money overall.
Remember that it's better to take small profits early than wait for a huge profit later, which may never come at all.
4. You want to cut losses as quickly as possible
Finally, you want to cut your losses as quickly as possible once the market starts going against you.
The last thing you want to do is let your losses grow larger and larger. It will only cause you a lot of pain and frustration over time.
It's best to cut your losses and move on quickly to another trade as soon as you can.
To protect your profits and reduce your risk exposure, make sure you'll always trade with a tight stop loss and have a clear profit target.
The Bottom Line
There you have it - a complete guide on how to trade the rectangle bottom pattern.
This pattern typically appears after a strong downward price movement, and shows an exhaustion of selling pressure in the market.
Following the previous downtrend, prices move sideways in a parallel channel before a breakout occurs.
The consolidation indicates that traders are not confident about the direction of the market, and that they are waiting for new signals before committing to a trade.
The trading range is then narrower as the price makes higher lows and forms a small triangle pattern.
The pattern is considered complete when an upward breakout is confirmed. You can place a long order once this happens and ride the momentum all the way to your targets.
It's important to note that rectangle patterns can also act as a continuation pattern that signals the continuation of prior downtrend.
Thus, you don't want to jump in too early, or you could be trapped in this bearish move for a long time. Only enter after a reliable breakout occurs to avoid unnecessary risks.
When this happens, you can look for a short entry, and place your stop loss above the high of the consolidation zone.
If you're trading with technical analysis patterns like rectangle bottoms, it's a good idea to avoid trading when the market is going sideways as you won't see any clear signals.
Keep in mind that no pattern is perfect, so whipsaws can happen anytime. So make sure you use proper risk management techniques to protect your profits and avoid big losses.
Don't forget to use this pattern with other trend reversal indicators for better results. Good luck and happy trading!

