You've heard about some traders making big gains with the broadening bottom strategy, but have you ever wondered how it works?
As the name suggests, the pattern is created when the price of a security "broadens" out, or becomes more volatile.
The pattern is usually followed by a strong rally, so you'll have to act quickly to capture profits.
In this article, we'll take a deep dive into the nitty-gritty of this profitable bullish chart pattern, and how it can help you predict future price movements of the market.
Okay, let's jump right into it.
What is a Broadening Bottom Pattern?
A broadening bottom can be characterized as a bullish reversal pattern.
This pattern is created when the highs become progressively higher, and the lows become progressively lower. This creates a "broadening" effect on the chart.
The occurence of this pattern indicates that selling pressure is weakening, and buyers are starting to step in. A breakout above the resistance level signals a potential trend change.
The pattern is said to get its name because the chart looks like a broadening formation.
Sometimes this pattern is called a megaphone bottom or a reverse symmetrical triangle.
While this pattern looks bearish at first, it's actually a bullish sign.
It indicates that the stock is gaining momentum and is likely to continue to move higher.
This is a great opportunity to get in on the action and reap the rewards of a market reversal.
Once you see that the stock price breaks up through the top of the pattern, it is a good time to buy.
The stock is likely to make a big move upwards. You can place a stop loss just below the recent lows to minimize your risk.
Bullish vs Bearish
The most important thing when it comes to technical analysis is to have a clear understanding of the market conditions.
You need to know whether the market is going up or down so that you can buy or sell accordingly. Knowing the current market conditions is critical to your success as an investor.
The market is currently in a broadening pattern, it means that there is a lot of indecision among traders.
This can lead to big swings in the market, which can be either up or down. You need to be aware of this and be prepared for both scenarios.
If you believe that the pattern will keep expanding, then you should be prepared for big swings and high volatility.
If you want to take advantage of both directions, you'll have to be careful with your position sizing and risk management since you don't want to get stuck on the wrong side of the market for too long.
If you think that the market is going to eventually break out of this pattern, then you just need to follow the trend and take some profits.
Example
Similar to the broadening top, the broadening bottom pattern is formed by two diverging trend lines, one connecting the troughs and the other connecting the peaks.
Keep in mind that the formation must have at least two minor highs and two minor lows.
The wider the bottom becomes, the more bullish the trend becomes. This means you can make some good profits in a short time if the price action breaks out of this expanding triangle.
This pattern can be found on any time frame but is most useful on longer time frames, such as daily or weekly.
You should also take into consideration that this pattern is usually a short-term signal and should be traded accordingly.
Now let's look at this bullish broadening bottom example:

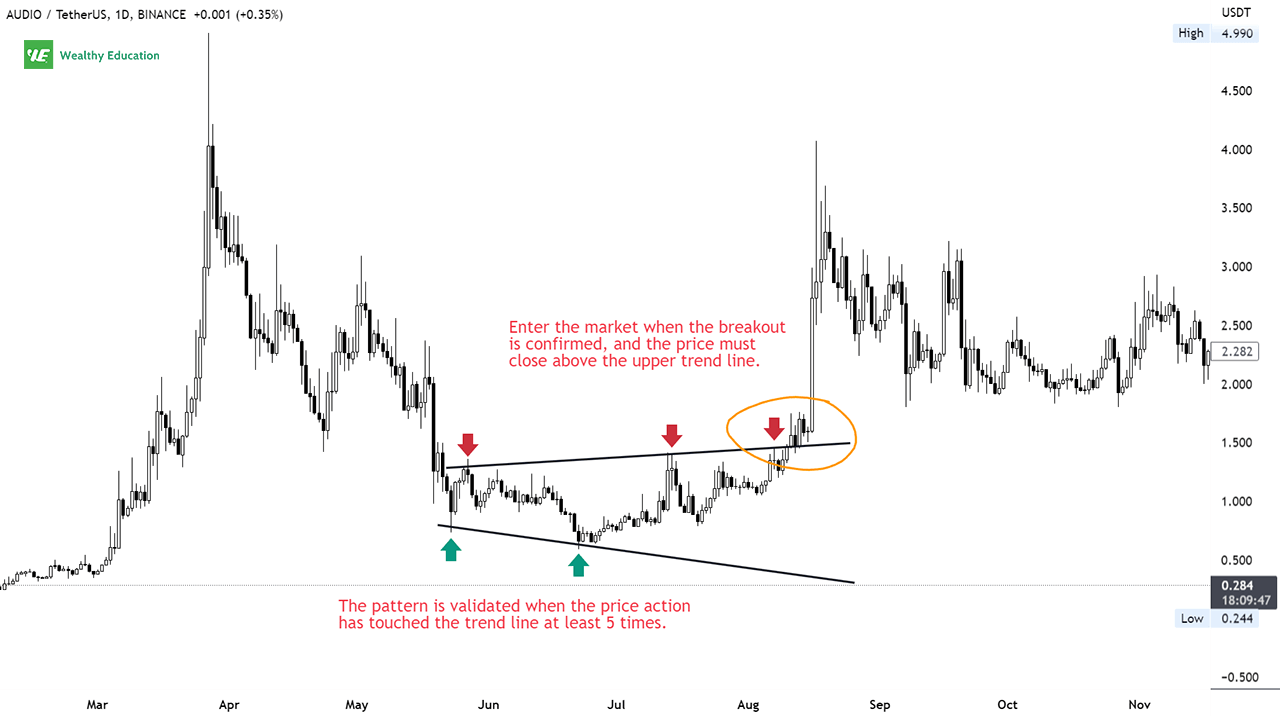
As you can see, AUDIO/USDT made a series of lower lows and higher highs, forming a widening bottom pattern.
The diverging lines must be touched at least twice to be validated, but 5-point touches are more preferable.
Since the troughs were getting shallower as the peaks got higher, it indicates that this coin was gaining momentum and an upward breakout was likely to happen.
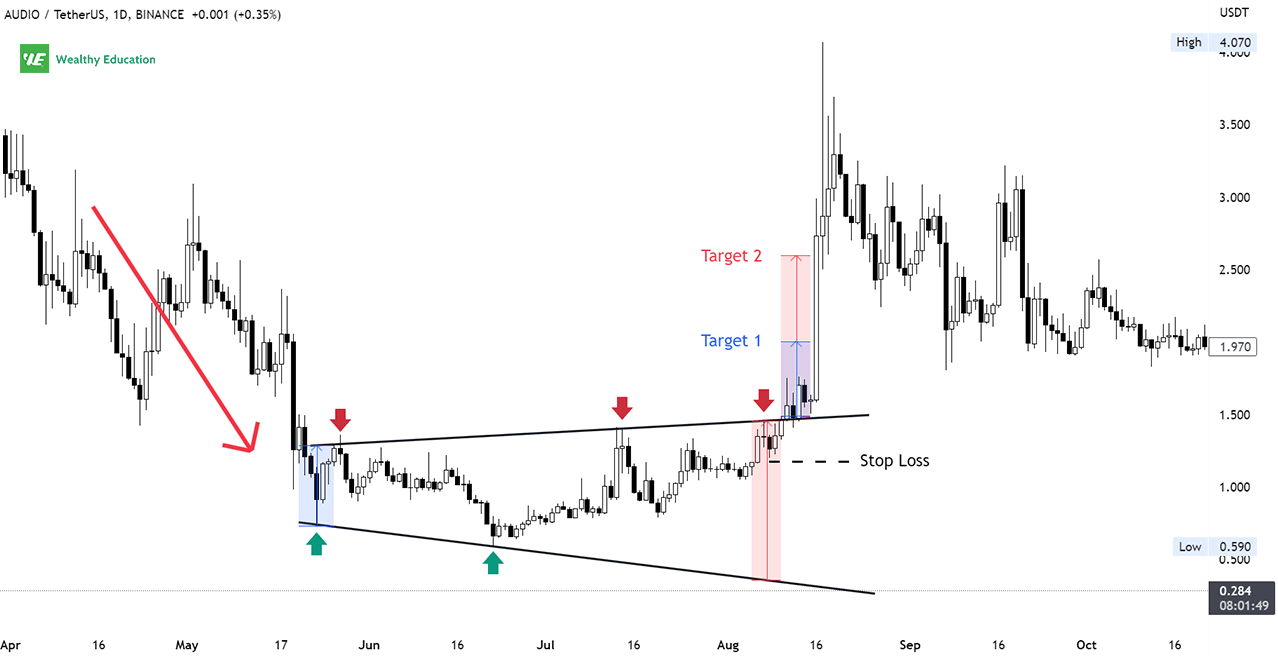
The pattern continued until the price broke out upward and rallied to a new peak of $4.07, an increase of $2.58 per token or over 273%!
How to Trade Broadening Bottom
There are two ways you can follow to trade widening bottoms:
The first is to wait for a breakout above the upper trend line. This will confirm that the trend has reversed. The stop loss can be placed below the recent lows.
The second way to trade the pattern is to wait for a pullback to the breakout point. This will provide a more conservative entry.
You need to pay attention to the size of the broadening bottom formation, the risk-to-reward ratio, the target price, and current market momentum.

As I mentioned earlier, the broadening bottom is an uptrend signal. This means that if it forms at the bottom of the downtrend, you can start looking for a buy setup.
This pattern indicates that bears are exhausted and bulls are ready to take control. So, if you're thinking of placing a long order, you need to be quick.
As soon as a breakout occurs, you can start placing your entry orders. Then, you want to watch the stock very closely.
Your profit target is simply the height of the pattern. A stop loss will be set based on your tolerance to risks.
If the selling pressure remains strong and the trend does not move in the way it should, you had better quickly cancel your orders to prevent a heavy loss.
Summary
The broadening bottom chart pattern is your indicator that a downward trend is coming to an end and a reversal may be on the way.
That's why it's important to know how to spot it, so you can make informed decisions with the best odds of success!
Here are a few things you need to keep in mind:
First, in technical analysis, the pattern is not considered valid until the top trendline has been broken.
You can use other chart patterns and candlestick formations to time your entries properly.
Second, the pattern is more reliable if it's found on longer time frames, such as a daily or weekly timeframe.
Finally, it is important to validate the market trend with some technical indicators, such as volume, RSI, and momentum, before taking a position.

