If you're trading a rectangle top pattern, and you don't have a solid technical analysis foundation, it can be very difficult to make winning streaks.
No matter what you do, you just can't seem to trade rectangle patterns without risking a loss. Why?
That's because this pattern can break out in either direction. So you always have a chance to be on the wrong side of the trend.
I've had the same problem for years. I always thought it was because I wasn't trading enough.
Now that I'm trading rectangles every day, I've discovered that they're actually a lot easier than I thought.
And that's why I wrote this article to help you take the guesswork out of trading, and teach you how to trade rectangle tops correctly.
Now let's get started...
What is a Rectangle Top Pattern?
A rectangle top pattern, also known as a bearish rectangle pattern or a horizontal channel top, is a bearish reversal pattern that appears at the end of an uptrend.
The pattern was first introduced by Thomas Bulkowski, who is a master technical analyst and a successful investor himself.
It is characterized by a long bullish move, followed by a consolidation period, and then a bearish correction.
This pattern is formed when prices bounce between two horizontal trendlines, with the upper line acting as resistance and the lower line acting as support.
You can draw two parallel trendlines to connect the peaks and troughs of the consolidation range. This will create a rectangle formation or a box-like shape on a stock chart.
Prices moving sideways within this rectangular pattern are a sign of indecision and weakness within the underlying uptrend.
The bulls and the bears will keep trading back and forth between the support and resistance lines until a breakout occurs.
A downward breakout occurs when prices break down through the lower support line of the rectangle.
This is a clear sign that the bullish momentum is exhausted, and that a downtrend is likely to follow.
When this happens, you can look for shorting opportunities when prices close below the lower trend line of the formation.
It's important to note that if this pattern appears in the middle of an uptrend, it may serve as a bullish continuation pattern.
In this case, an upward breakout occurs when price goes higher and closes above the upper resistance trendline.
Is Rectangle Pattern Bullish or Bearish?
Rectangle chart patterns are bilateral patterns, hence they can both bullish and bearish, depending on the current market sentiment and the breakout direction.
If the price breaks out above the upper trendline and closes above it, this is a bullish signal that confirms a continuation of the prior uptrend.
In this case, you can buy into the trend when prices retrace to retest the resistance level, and place a stop loss below the recent low.
On the other hand, if a breakdown happens, and the price closes below the lower trendline, this is a bearish signal that confirms a reversal to the downside.
In this case, you can sell short when prices pullback to the support level, and place a stop loss above the recent high.
Is a Rectangle a Continuation Pattern?
Unlike other reversal patterns, the rectangle tops formation can also act as a continuation signal of the prevailing uptrend.
Prices oscillating between the upper and lower parallel trendlines show a pause in an existing trend and indecisiveness among traders.
During this consolidation phase, buyers and sellers are battling it out for control of the market.
When buyers eventually take control and push prices higher, this signals that selling pressure has weakened considerably, and you can predict that the current uptrend is likely to continue.
Bearish Rectangle Formation
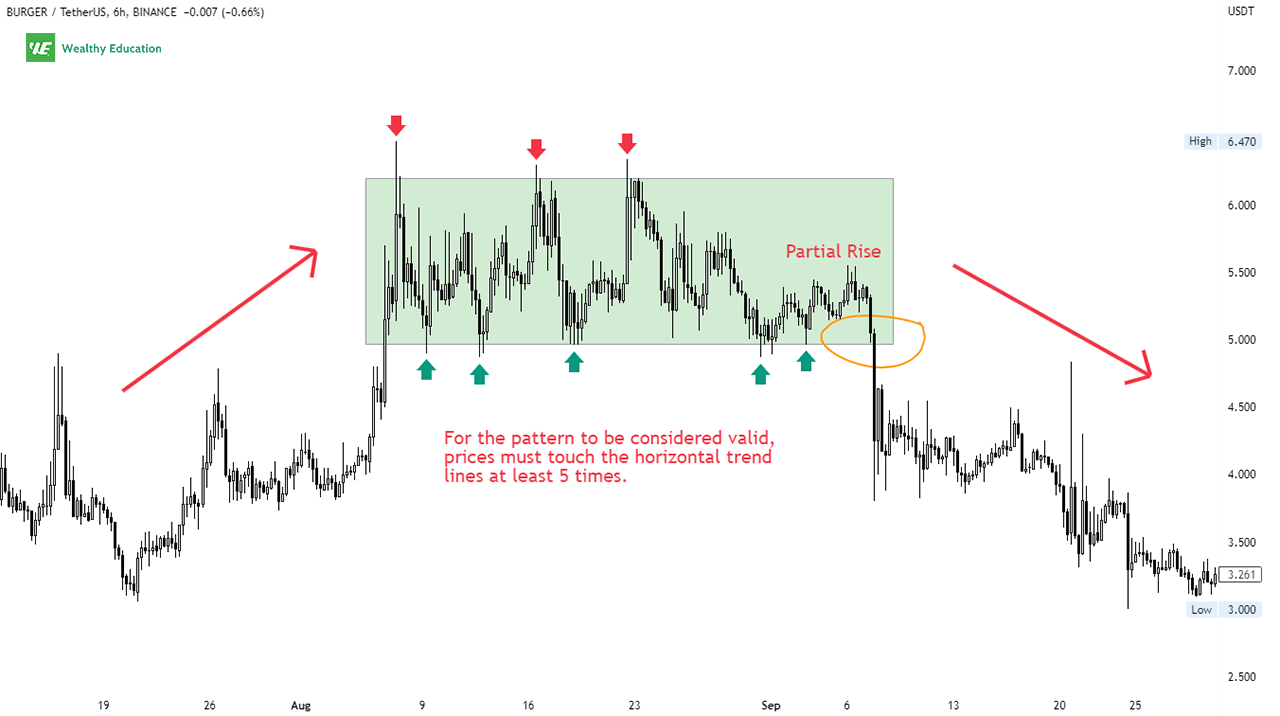
A bearish rectangle top pattern forms during an uptrend when prices consolidate between resistance and support levels.
By drawing two horizontal trend lines to connect the peaks and valleys of the consolidation, you will see a rectangle shape on the chart below.

You'll want to see prices touch the highs and lows of the consolidation at least 5 times to confirm a valid formation.
After a period of sideways movement, more sellers step in and push prices lower to the support boundary.
In my experience, the price action does not break through the support level immediately, but bounces off this level multiple times before finally breaking it.
Sometimes, you will see partial rises in price as sellers attempt to push prices below the support boundary, but buyers keep buying into the dips and driving the market higher again.
This is a warning sign that the support level is so strong that it's not easy to break it with constant selling pressure.
However, when the support is broken, it opens the door for more sellers to enter the market, and leads to a breakout to the downside.
A downtrend then develops as bearish momentum starts to pick up steam and pushes prices even lower.
Notice that volume tends to be diminishing during the rectangle top formation, and spikes on the breakout.
If volume increases as the market declines, that's a sign that more sellers are entering the market to push it down further.
Keep in mind that a high volume breakout is usually followed by a sustained move in the same direction. Conversely, low volume breakouts tend to fizzle out within a short period.
Thus, make sure you will take volume into account when trading this chart formation to avoid false breakouts and unnecessary losses.
Example
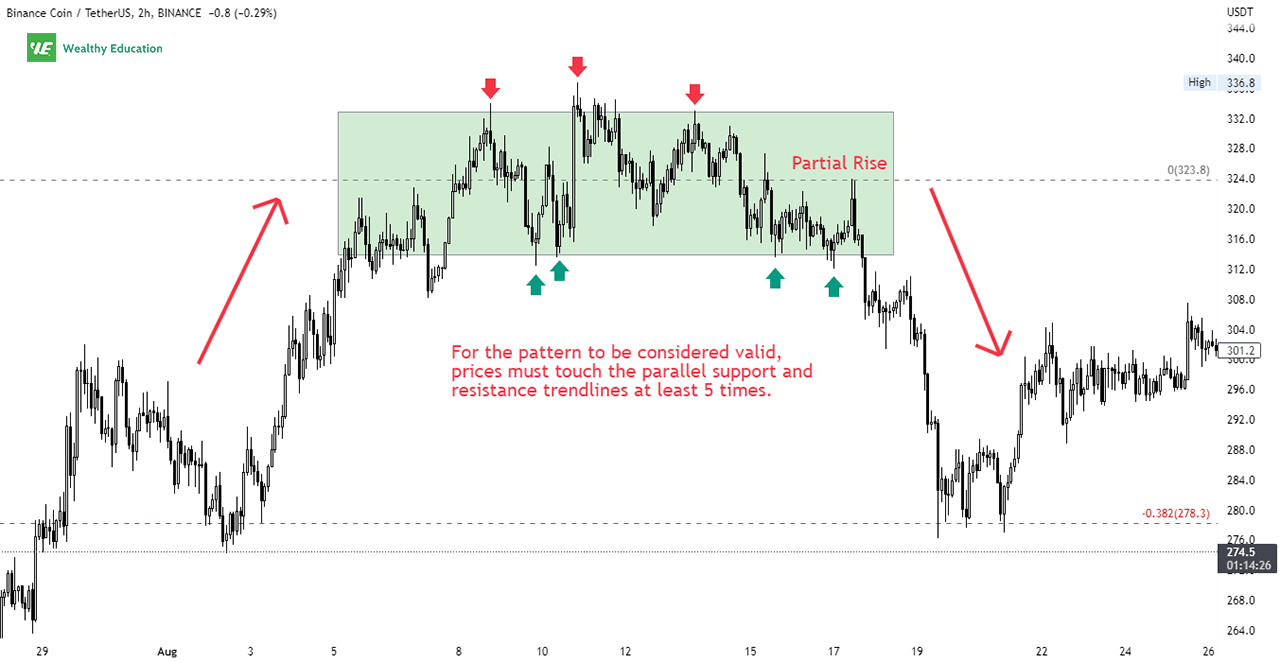
Looking at Binance Coin (BNB/USDT) chart below, you can see how a rectangle top chart pattern formed during an up trending market.

Notice how the price action consolidated between the two horizontal lines. The top trendline served as a resistance level, whereas the bottom one was a support level.
You can see that partial rises happened when prices hit the support level and bounced back up quickly to $323.81. A downward breakout occurred thereafter.
The rectangle top formation was fully complete when the breakout candlestick closed below the support line.
Momentum turned bearish as there was a high volume breakout below the support boundary at $313.71. Prices then dropped by 13.45% to $276.52.
So how do you trade a rectangle pattern?
How to Trade a Rectangle Top Chart Pattern
Similar to rectangle bottom patterns, the safest way to trade the rectangle top formation is to wait patiently for the price to break out of the rectangular area.
Keep in mind that rectangle patterns can be both a reversal pattern and a continuation pattern.
This simply means that the breakout can occur in either direction: upside or downside.
So the first thing you'll want to do when trading rectangles is to identify which direction the breakout will likely be.
You can easily do this by looking for partial rises or partial declines within the horizontal channel.
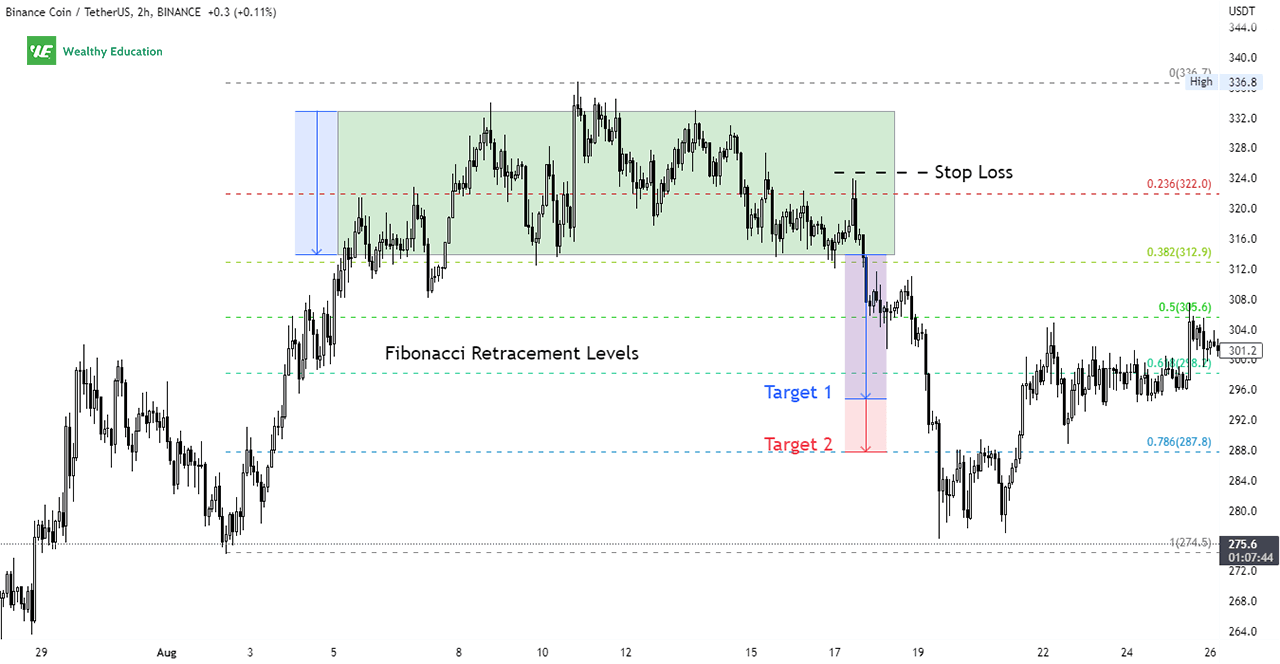
Notice how the two parallel trendlines form a rectangle on the chart below.

As you can see, prices bounced off the lower support trendline several times before breaking below it.
Enter a short position when the breakout candle closed below the rectangle formation, with a stop loss above the high of the partial rise.
Your ideal profit target can be either the height of the rectangle, or Fibonacci retracement levels.
The height of the pattern is measured as the distance between the two support and resistance trend lines.
In this case, the distance between them was $333 - $314 = $19, so the height was around $20, and your price target for this short trade was $293.
Summary
The rectangle top pattern trading strategy is quite easy to implement.
All you want to do is to wait for a breakout to occur in either direction. Then, you can trade in the direction of the breakout with a decent risk-to-reward ratio.
However, you should not enter the market immediately when the breakout happens. You had better wait for confirmation.
For example, if the breakout is downward, you can look for a bearish reversal candlestick that forms right under the breakdown point.
Harami, three black crows, and three outside down patterns are some good examples of bearish candlestick formations.
You can place a short order when the breakout candle closes below the bottom trend line of the rectangle top stock pattern.
Make sure that you'll always trade with a proper risk management strategy to protect your profits in case the price reverses suddenly against you.
Finally, you can check out our Chart Patterns cheat sheet here to learn more about other types of chart patterns.

