If you are a trader, then you already know that it can be difficult to trade a diamond bottom pattern.
You know it's coming - the diamond. In fact, you've seen it time and time again, but you've never been able to trade it successfully. Now it's happening again.
I love this chart formation. But why do so many traders struggle with this one?
It seems like everyone can trade it, and then some can play with it very well... but some people just can't.
Do you know why? That's because they don't understand the concept behind this formation.
The idea here is that, like all patterns, the bullish diamond bottom has its own rhythm. Once you recognize that, you can trade it successfully.
Now let's dive into this pattern, and see what we can do with it.
What Is a Diamond Bottom Pattern?
The diamond bottom pattern is a short-term bullish reversal formation that occurs after an extended downtrend. It is characterized by a sharp decline, followed by a period of consolidation, and then a breakout with increased volume.
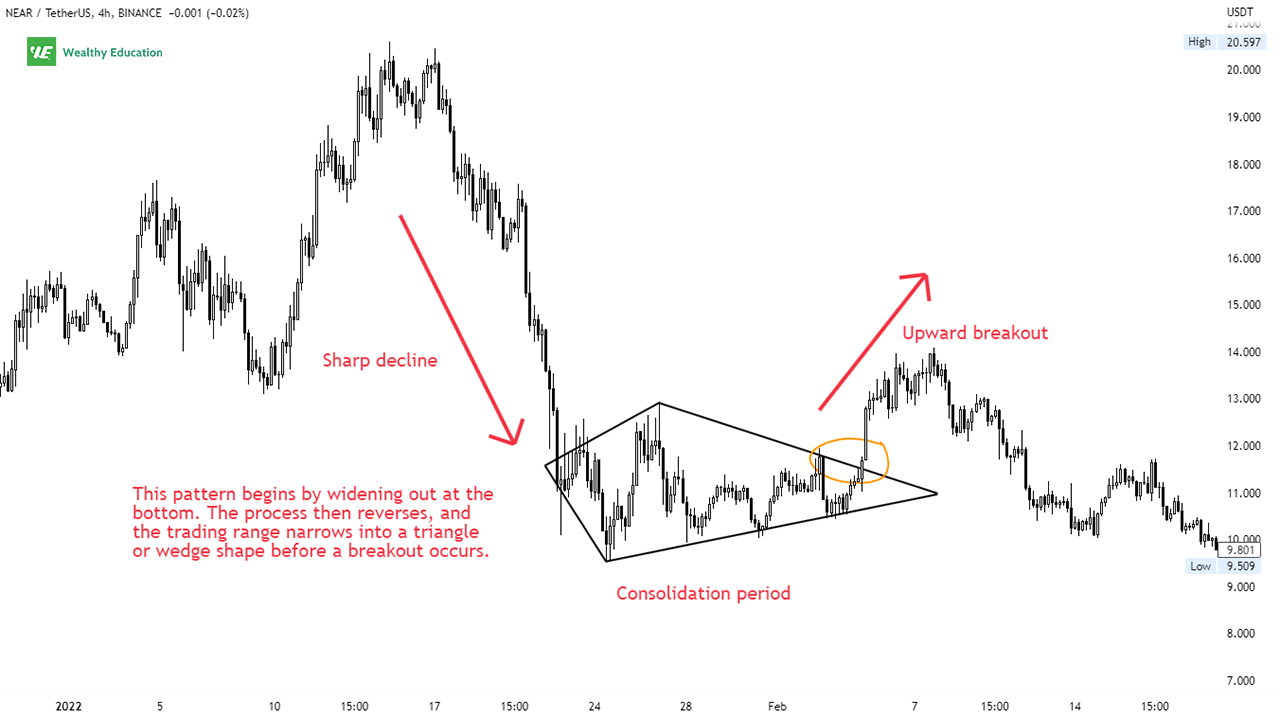
This pattern begins by widening out at the bottom as sellers are losing control and buyers begin to take over. The battle between buyers and sellers results in a sideways trading range (or consolidation) that forms between key support and resistance levels.
The process then reverses, and the trading range narrows into a triangle or wedge shape before a breakout occurs. The breakout can occur in any direction, depending on who are going to control the market.
Overwhelming selling pressure will result in a breakdown below the support level, while strong buying demand will lead to a break above the resistance level.
When trading the diamond bottom reversal pattern, you'll find that it's often followed by a strong upward price movement, so your bet can be on the upside.
Is a Diamond Pattern Bullish or Bearish?
The diamond pattern can be either bullish or bearish, depending on the direction of the breakout.
If it breaks up through the top trendline, the pattern will be confirmed as a bullish signal, and an upward price movement will likely follow.
However, if the break is below the support line, the pattern will be confirmed as a bearish signal, and the price is expected to drop lower.
You can find diamond patterns in both uptrends and downtrends. They usually occur near the end of the trend because that's when the market is exhausted.
The diamond top and bottom can be both a reversal and continuation pattern at the same time, so you'll need to be careful when deciding which direction to trade them.
Formation
A diamond bottom chart pattern occurs after a significant decline in price, as the market reaches a support level and begins to rebound.
It takes some time for the bearish sentiment in the market to dissipate completely, but when it does eventually happen, things can get pretty volatile and impulsive.
If you notice, this formation is first created by a broadening bottom chart pattern (or a broadening wedge pattern) where buyers and sellers meet in the middle and create a trading range.
The price action then forms a symmetrical triangle pattern and flattens out as the bulls and bears battle it out for control of the market.
You will see a downward breakout happen when sellers regain control of the market, and drive prices down below the support level.
On the other hand, an upward breakout indicates that buyers have won the battle, and they are willing to step in to push the price higher.
Now let's have a look at a quick example.
Bullish Diamond Pattern Example
As you can see, this pattern resembles a diamond when it's drawn on a price chart. It's called a diamond bottom because it forms at the bottom of a downtrend.

By drawing trend lines connecting the minor highs and lows, you can visualize the formation, and get a better idea of where the market is headed next.
The diamond bottom often forms after a sharp decline, followed by a sideways period, and then a breakout with high volume.
You should keep in mind that the breakout direction can be up or down, so you need to be careful when deciding on your buy or sell setup.
In this example, the upward breakout took place when the price broke above the upper trend line. The bullish signal was confirmed when the price rallied and closed above $12.
Trading Strategy
The diamond bottom trading strategy is fairly simple, and it's the most effective way to capture some profits in a bear market.
The key to trading this pattern is to follow the trend - either up or down - and trade in the direction of the breakout. All you want to do is to wait for the price action to break above or below the diamond shape.
If it happens on the upside, go long and wait for the price to reach your profit target. And vice versa, if a breakdown occurs, simply enter a short position and ride the trend down.

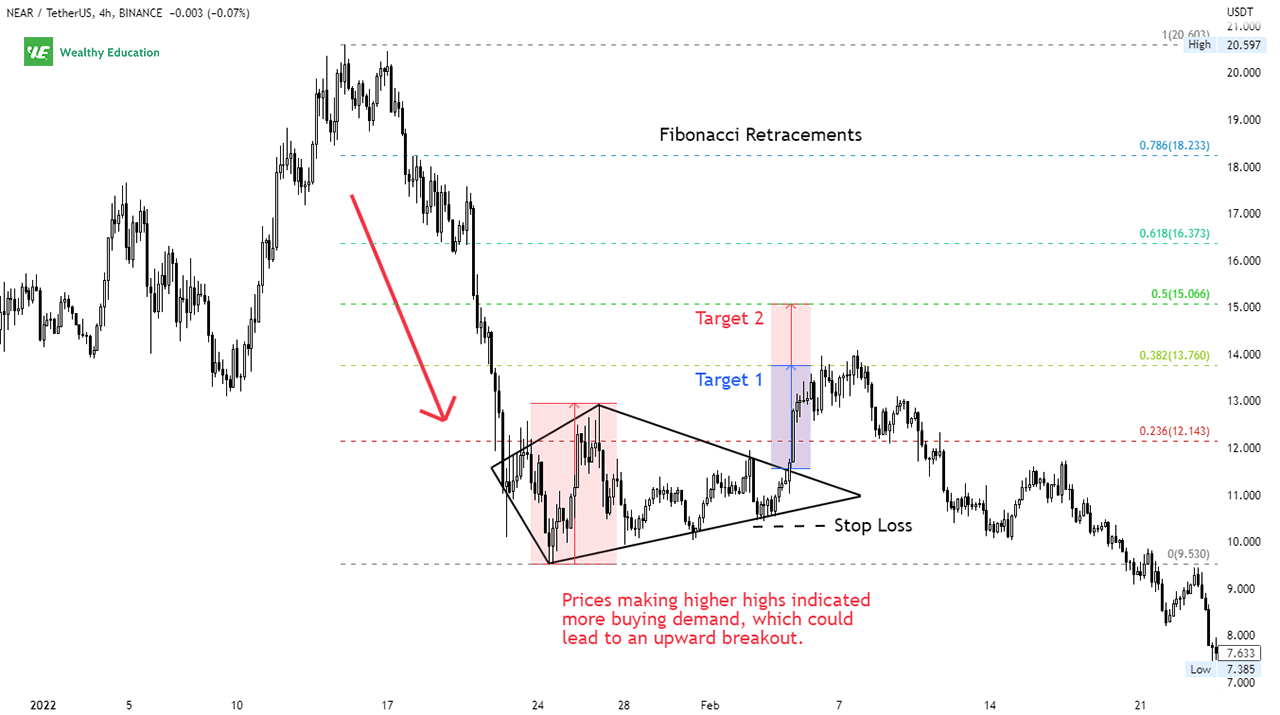
Your price target can be the height of the diamond, or slightly below it. You can also use Fibonacci retracement levels to set your target profit.
Make sure you set a clear stop loss to limit your risk exposure and manage your account effectively.
You can place a stop loss just below the most recent low, or the low of the diamond. If the market goes against you, you can simply close your position, take a small loss, and move on!
When it comes to technical analysis, you can't just ignore the importance of buying and selling volume because it tells you exactly what's going on in the market right now.

Volume throughout the diamond formation should be diminishing as traders are uncertain of which way the market will go next.
The breakout usually takes place after a long period of indecision in the market. So when the volume picks up again, that's when you make your move!
A spike in volume is always a good indication that the price is ready to break out from the pattern, so keep an eye on it. It also provides confirmation that the break is for real and not a fakeout.
Head and Shoulders Patterns vs Diamond Patterns
If you compare a head and shoulders pattern to a diamond pattern, you'll notice that both of them look quite similar, and share the same characteristics.
For example, a bearish diamond formation, also known as the diamond top pattern, sometimes looks identical to a head and shoulders chart pattern.
And vice versa, a bullish diamond pattern, known as the diamond bottom pattern, looks similar to an inverted head and shoulders pattern.
The only difference is that diamond patterns can break out in both directions (either up or down), depending on market conditions.
7 More Powerful Tips to Boost Your Trading Results
If you want to improve your trading performance, here are seven useful tips that will help you trade the diamond chart patterns like a pro:
- Look for a well-defined diamond reversal pattern on the stock chart. The diamond pattern should have clear boundaries and be easy to identify.
- Pay attention to the price action leading up to the formation. A steep decline followed by a period of consolidation is a good indication that a trend reversal is about to take place.
- Always follow the direction of the trend. In my experience, the breakout from the diamond usually signals a strong move in the opposite direction.
- Wait for confirmation before taking any position. Prices must close outside the diamond shape to confirm a trend change. This will help you to avoid getting caught in a false breakout.
- Pay attention to the volume during the formation, and on the breakout. Volume should be declining as the diamond pattern develops, but pick up sharply once the breakout occurs.
- The target level for the pattern should be the same as the height of the diamond. Always consider a risk/reward ratio, and size your position accordingly. Just make sure you'll never risk more than 2% of your account on a single trade.
- Make sure you use this bull market chart pattern in conjunction with other technical analysis tools to confirm its validity and avoid false breakouts.
Summary
Congrats to you for sticking with my article until the end. You are one of those traders who know how to trade the diamond pattern well.
The diamond bottom is a rare technical analysis pattern that you can use to quickly spot key turning points in the market.
The pattern is formed by four price points that resemble a diamond. The first and fourth points are at the same level, while the second and third points form a peak and valley.
The ideal diamond bottom has a sharp decline followed by a consolidation period. The consolidation period is important because it shows that the selling pressure is weakening.
This pattern is considered a bullish signal if the price breaks out above the top trendline, and a bearish signal if the price breaks down below the lower trendline.
Once the trend is confirmed, you can enter the market accordingly, and aim for a proper risk reward ratio with a tight stop loss in place to manage risk effectively.
You should also pay attention to the volume because it will tell you exactly whether the bulls or bears are in control.
Make sure you're on the right side of the market to make the most profit!

