A reverse head and shoulders pattern is a classic trend reversal indicator, but trading this chart formation can be difficult for the average trader.
It's not because there is a "secret" to trading this pattern, but rather, most traders simply fail to get in the market at the right time.
Timing is the most critical aspect of any trading strategy, and when it comes to finding opportunities on the charts, timing is everything.
In this article, I'll break down everything you need to know about the inverse head and shoulders pattern, including how to identify it on a stock chart, and how to trade it successfully.
Okay, let's get started...
What Is a Reverse Head and Shoulders Pattern?
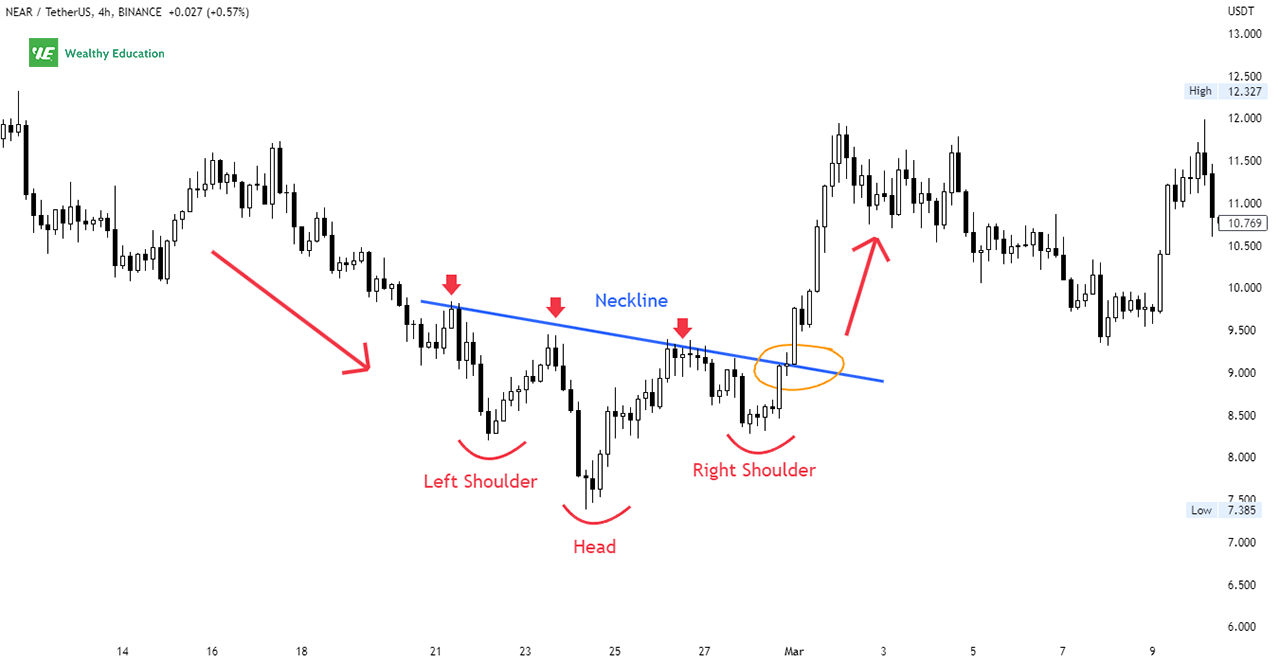
A reverse head and shoulders chart pattern is a short-term bullish reversal pattern that occurs near a market bottom.
It consists of 3 consecutive troughs with the middle trough lower than the other two, which form a head and two shoulders on a price chart.
You can easily find this formation at the end of a downtrend, when the market hits temporary lows and bounces back strongly.
The strong rebound indicates the end of the downtrend and start of a potential reversal period.
The market reverses to the upside when the price rises and breaks out above the neckline of the pattern.
The neckline is simply the line that connects the highs of the two shoulders and the top of the head.
It forms a strong resistance level that the market has to overcome to confirm a successful breakout from the pattern.
The reverse head and shoulders formation has several other names, such as:
- An inverted head and shoulders
- An Inverse head and shoulders
- or a head and shoulders bottom pattern
These patterns are the same, just different in how they are named.
So I will call this pattern in different ways throughout this article, so you can refer to it more easily in the future.
Formation
The inverse head and shoulders chart pattern looks exactly like a standard head and shoulders, except that it's flipped upside down.
It's characterized by 3 consecutive troughs with the center trough being the lowest one.
This pattern can appear in both uptrends and downtrends, but you'll see it more frequently on down trending markets.
When drawing a trend line that connects the highs of the troughs, you will see it forms the shape of a head in the middle with two symmetrical shoulders on either side.

The pattern is considered complete when prices move above the top of the right shoulder, and then breaks above the neckline of the formation.
If the price fails to break up through the inverse head and shoulders neckline, then the pattern is considered invalid, and it's no longer a reliable trading signal for an upward trend reversal.
As with other chart patterns, you'll need to pay close attention to the trading volume.
In most cases, volume tends to be decreasing during the formation period, but increases dramatically once the breakout occurs.
In my experience, volume normally spikes on the left shoulder or head. It will decline gradually on the right shoulder, and then surge on breakouts.
Head and Shoulders Bottom Example
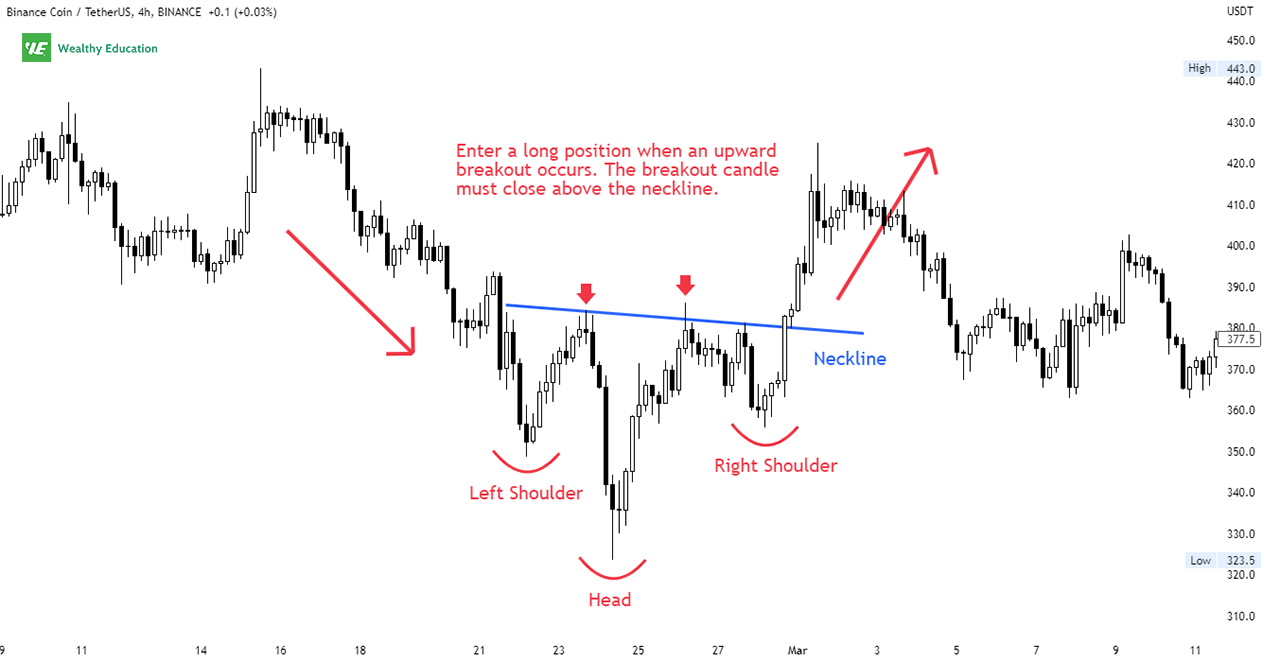
Here is an example of the inverted head and shoulders pattern on the H4 chart of Binance Coin (BNB/USDT).

As you can see in the example, the price was trading in a downtrend from $443 to $323 before bouncing back strongly to create an inverse head and shoulders formation on the chart.
You can easily draw a neckline by connecting the highs of the last three troughs. In this case, the neckline is drawn as a down-sloping blue line.
An upward breakout occurred when the prices moved higher and broke up through the resistance neckline at around $380.
Prices started rising shortly thereafter, and hit a high of $425 after the neckline breakout.
How to Trade The Inverse Head and Shoulders
The inverse head and shoulders trading strategy is fairly straightforward. You can wait for an upward breakout through the resistance trend line.
Prices closing above this resistance neckline confirms that the downtrend is over, and the market is reversing to upside.
You can then enter a long position in the direction of the breakout. For example, we could buy BNB/USDT when it broke out above the resistance line at about $380.

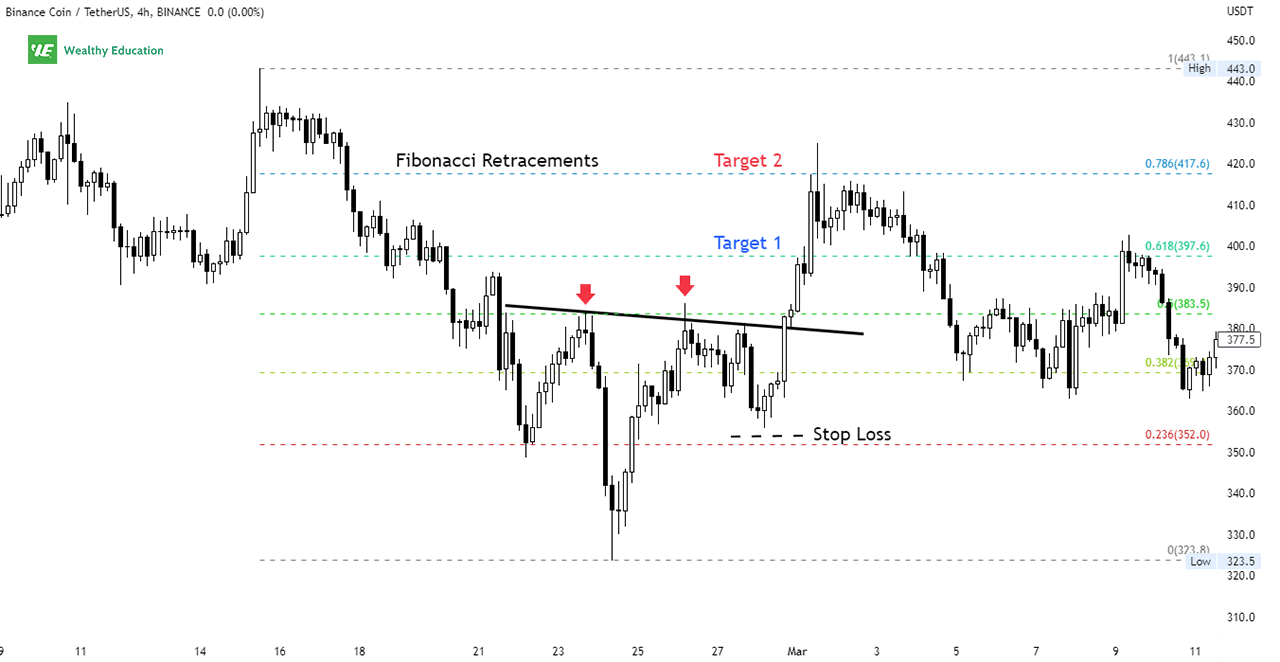
Your profit target can be the distance from the neckline to the low of the head, added to the breakout point.
However, this fixed target is not always practical because we don't know how far the price will rise after the rally from the neckline.
So, if you're looking for more reliable price targets, you can use Fibonacci retracements levels.
These golden ratios mean a lot in technical analysis because they tend to act as support and resistance over and over again.
Because the breakout is upward, you want to place a stop loss below the low point of the right shoulder.
This way, if prices reverse and start to fall again, your trade will be stopped out before you lose too much of your initial investment.
It's important to note that you may see a pullback when prices move back down to re-test the resistance neckline.
Since prices have moved above the neckline, the previous resistance level now becomes a new support level.
If the price hits the support level and bounces back up, this is a very good sign. It indicates that the bullish momentum is strong, and you can be more confident with your target profits.
How to Deal With False Breakouts
The inverted head and shoulders formation has been used extensively in technical analysis as it provides reliable bullish reversal signals.
The break above the top of the right shoulder is a bullish signal, so it makes you feel very confident of the uptrend.
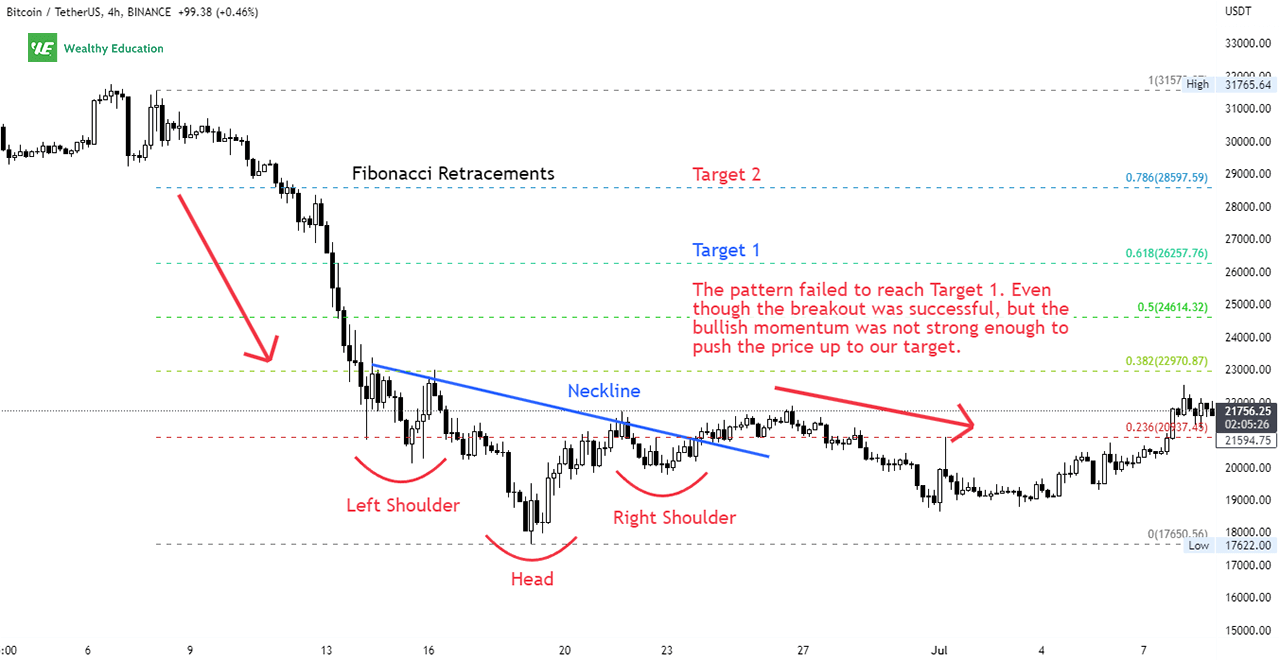
However, you should be aware of the potential fakeouts that can occur in this setup as well.
Here's an example of a failed inverse head and shoulders pattern:

Keep in mind that not every breakout above the neckline turns out to be a successful one. This depends on the strength of the market and the size of the breakout candlestick.
When prices break above the neckline, it should be a strong move that confirms the downtrend is over.
If the price moves slowly and grinds up, then it's a warning sign that the upward movement is not as strong as you think it is.
The market is still undecided about the direction it's going and could still go either way.
So you'll want to wait for the price to close above the neckline of the pattern before jumping in.
This way, you can reduce the likelihood of being whipsawed in case the market suddenly turns down again.
Inverted Head and Shoulders Rules
If you want to master the inverted head and shoulders chart pattern, you'll need to understand all the rules associated with this formation.
Here are the most important ones:.
1. Neckline Should Slope Down
In my experience, inverted head and shoulders patterns with a down-sloping neckline perform much better, and upward breakout usually leads to strong rallies.
This indicates that the downtrend is still in effect, and the current resistance is strong enough to hold the price from moving higher.
If the price can break this strong resistance level, it indicates buyers are strong enough to push the price up.
2. The Symmetry of The Shoulders
Symmetry is another key factor that you'll need to consider when analyzing a reverse head and shoulders stock pattern.
If you notice, you will see a valid head and shoulders have the same height on both the left and right shoulders - they shouldn't be too wide or too narrow.
That's to say, the right side of the pattern should be symmetrical to the left side. If the two shoulders look different in size, you should be wary.
The right shoulder should drop to the same price level as the left shoulder, and their distances from the head are about the same.
3. Changes in Trading Volume
Volume is a major factor that you should take into account because it helps you identify the strength of the market.
A high volume indicates a large number of buyers and sellers in the market. When the volume is decreasing, that's a sign that the current trend is losing its momentum.
When you see volume decreasing gradually through the development of the pattern, this is a sign of weakness in the market.
A volume spike on the breakout day is a sign that traders are buying aggressively after the long decline.
This marks a change in market sentiment and indicates the beginning of a new uptrend.
Therefore, you can use volume as a way to confirm the strength of the inverted head and shoulders breakout.
The greater the volume and the faster it increases on the breakout of the neckline, the stronger the move is likely to be.
4. Breakout Candle Closes Above The Neckline
Prices should break out above the neck line to confirm the bullish signal; but how do you know if the breakout is valid?
The best method is to look at the closing candle of the session when the price breaks through the neckline.
Ideally, this candle must be a bullish candlestick, and it must close above the neckline.
FYI, bullish reversal candlesticks include a hammer, inverted hammer, morning star, and three white soldiers patterns.
If the price action doesn't make it to break the resistance, you should be careful because the bearish reversal will likely happen.
This pattern forms in volatile markets, and prices may break above or below the neckline.
That's why you need to wait patiently for confirmation, and always enter the trade with a tight stop loss to minimize your risk if the pattern doesn't work out as expected.
The Bottom Line
As you see, the head and shoulders bottom formation is a powerful bullish chart pattern that can give you reliable buying opportunities to ride the market.
The pattern has clear rules, and it's easy to make the right call if you pay attention to the details surrounding the formation.
Once the price action breaks out above the neckline, it marks a potential change in trend direction, and signals the start of a new uptrend.
You can measure the distance between the head and neckline, and the size of the pattern to determine a suitable profit target.
However, your inverse head and shoulders target can also be set based on Fibonacci golden ratios, and the most reliable target prices are usually around the 0.168 and 0.786 levels.
This pattern has a strong track record for success as a trend reversal trading signal, especially when it's used with other trend-following indicators and candlestick patterns.
However, you need to be careful because any wrong decision can wipe out your entire trading account in no time.
So make sure that you'll always trade with a strict stop loss to minimize your risk in case the pattern doesn't work out as expected.

