If you are looking to learn how to trade bull pennant patterns, you've come to the right place!
I've been trading this chart pattern for a long time, and it is something that I consider my bread and butter.
If you are a swing trader, intraday trader or scalper, and you want to be on the right side of the price action, you need to learn how to spot this powerful formation.
The problem is, most people think it's a hard pattern to trade... And so they quit before they ever get started.
But there's an easy way to trade this pattern. And that's exactly why I published this comprehensive guide for you.
You'll never have to worry, "What should I do next?" or "Am I doing the right thing" ever again.
In this article, you'll learn all the ins and outs of bullish pennant patterns, and how you can maximize your profit potential.
Okay, now let's dive into it.
What Is a Bull Pennant Pattern?
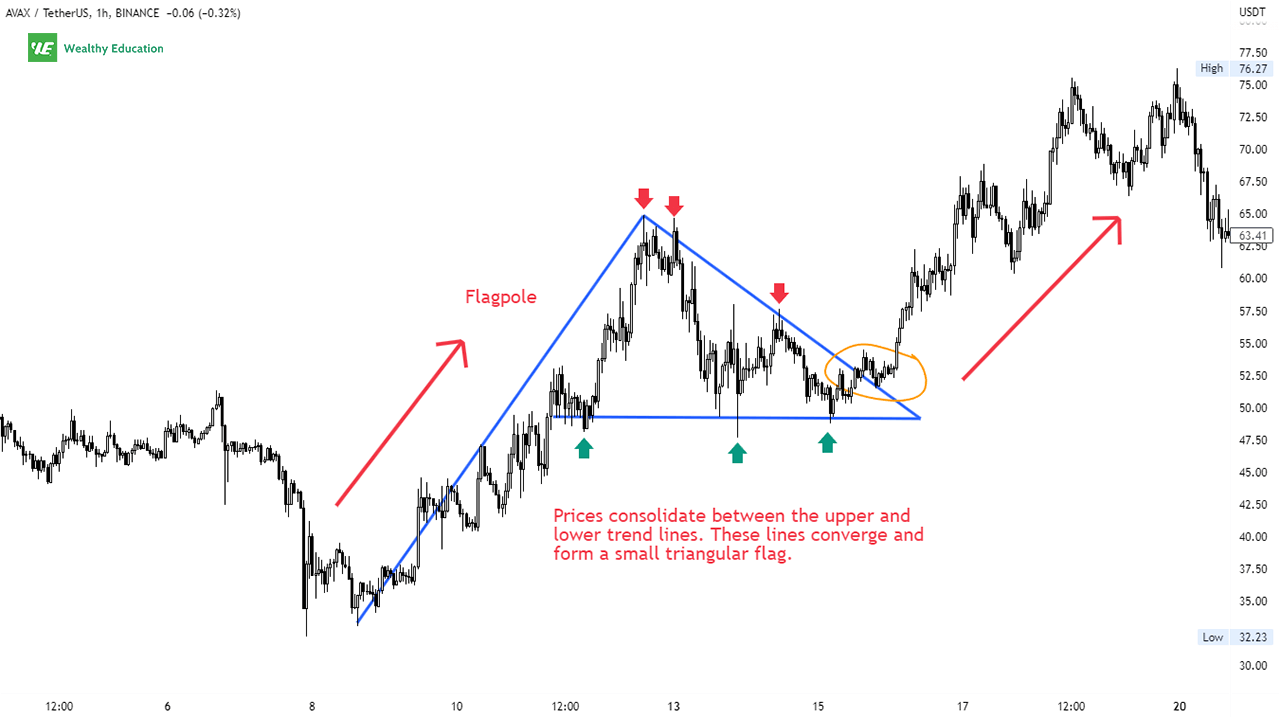
A bull pennant pattern is a bullish continuation pattern that appears on a stock chart as a down-sloping triangular flag. It consists of two parts: a flagpole and a pennant.
The flagpole is the vertical distance between the highest peak and lowest trough. It is created by a sharp increase in price, followed by a period of consolidation.
The pennant shape is created by the price gradually decreasing as it moves from the high of the flagpole to the low of the consolidation period.
You will see this formation when prices stall out and start moving sideways after a strong uptrend.
It represents a pause in the upward momentum, where traders take a break to re-evaluate the current market situation.
The breakout from the pennant to the upside occurs when the price action begins to rise, and eventually breaks up through the top trendline.
This indicates that the momentum is starting to pick up again, and that more buyers are stepping in to take over the market.
When this happens, you can expect a continuation of the previous uptrend.
Formation
The bull pennant stock pattern is made up of two converging trendlines, with the lower trendline representing support, and the upper trendline representing resistance.
This formation often has a slight downward slope, and the price action moves in a narrowing range between the two trend lines.
It's important to note that the pennant doesn't necessarily slope down. It may slope up or even look horizontal, but it often slopes against the leading trend.
You will see this pattern occur frequently during major uptrends, as the market consolidates before continuing its upward movement.

You will also see decreasing volume throughout the consolidation period, as traders become uncertain of the direction of the market.
The pattern normally lasts anywhere from one to three weeks, and during this time, prices will fluctuate within the trading range.
If it lasts longer than 3 weeks, you can carefully consider it to be a symmetrical triangle or rising wedge instead.
The bull pennant breakout signals a continuation of the prevailing uptrend. This indicates that there is a lot of buying demand in the market, and buyers are eager to step in and push the price even higher.
That's why the bull pennant formation is considered as a half-staff pattern. This means the trend leading to the chart pattern is as strong as the trend following it.
Therefore, this pattern often has a good success rate, and the probability of achieving its measured move is high as well.
Now let's have a look at an example.
Example
The bullish pennant chart pattern occurs when the market rallies to a new high, consolidates for a few days, and then continues moving higher.
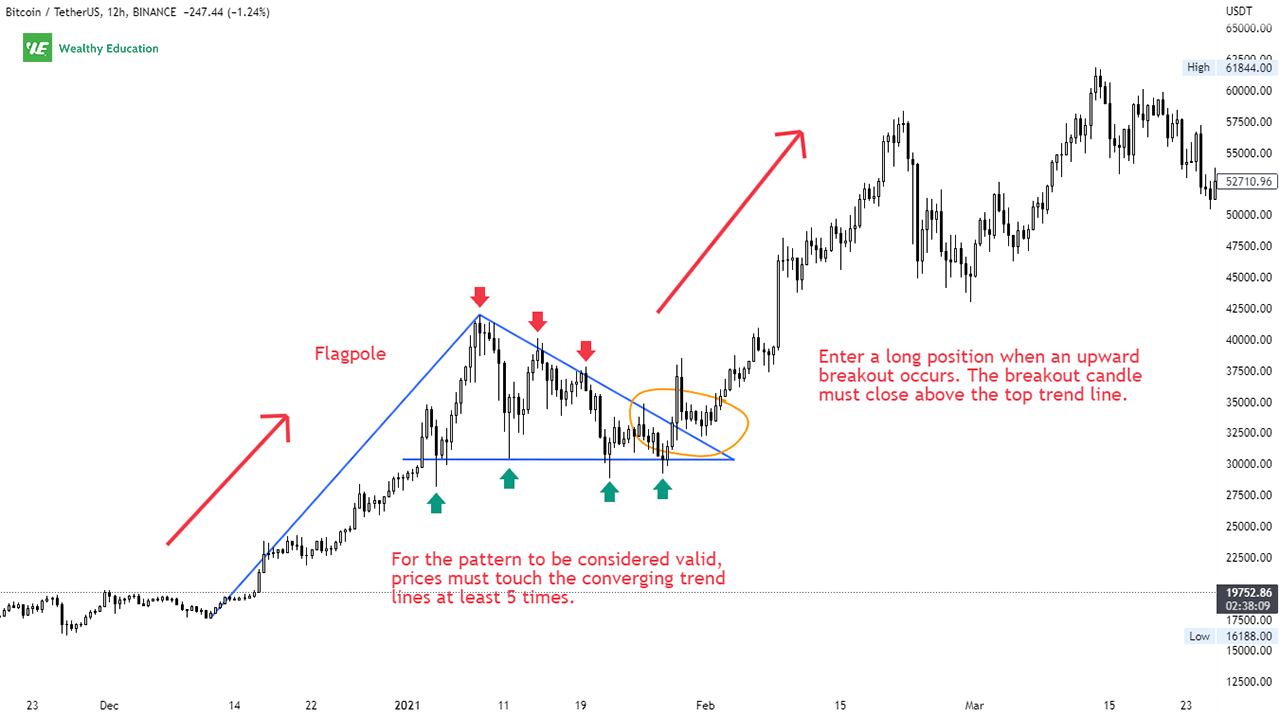
As you can see from the chart of Bitcoin (BTC/USDT), the price action forms a flag-pole top at around $42,000 before sloping down slightly at a 45-degree angle. This is also known as a descending bull pennant.
You can draw two converging trendlines that connect lower highs and higher lows to form a triangular flag.

The prices move sideways between these trendlines until an upward breakout occurs.
Volume during the consolidation period is diminishing as traders become uncertain of the direction of the market.
When the breakout direction is confirmed, you will see that volume starts to surge as buyers are rushing in to push the price higher.
How to Trade a Bullish Pennant Pattern
The bull pennant trading strategy is fairly simple: place a buy order or go long at the breakout of the flag formation.
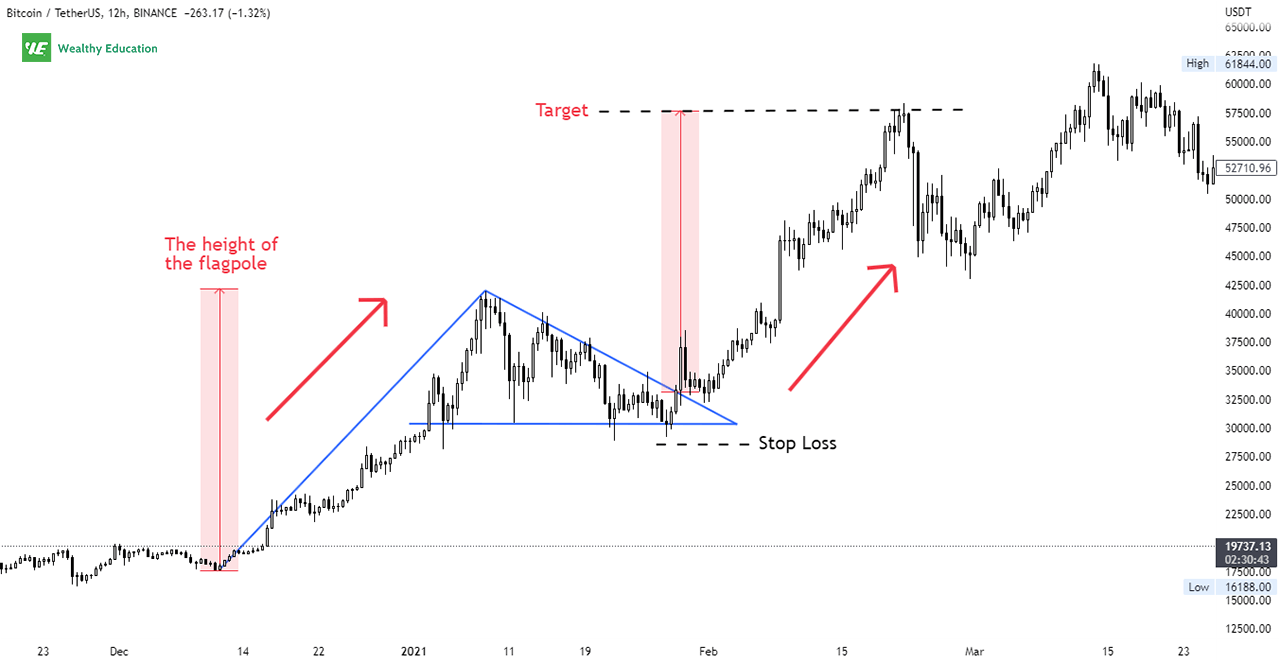
A breakout from the top pennant is typically seen as a bullish signal, with the height of the flagpole determining the potential upside of the move.
It's pretty straightforward - you just need to keep in mind that the higher the flagpole, the bigger the potential gain!

You can enter the trade when there is a bullish candle that closes above the top trend line. This trend line now becomes a support level, so it can be a good entry for a long position.
The price target for this setup is calculated by adding the height of the pole to the breakout point.
A stop loss can be set based on your risk tolerance. In most cases, you can place a stoploss order below recent lows.
Bull Pennant Reversal Signal
Even though this pattern comes with a high winning percentage and accuracy, you can still get it wrong sometimes.
Similar to other breakout chart patterns and technical indicators, the pennant can be a false signal if it fails to break out as expected.
Well, you should be aware that a breakdown may happen if there's a significant bearish event that affects the market sentiment.
The failed bull pennant reflects a weakening in the uptrend, and it usually leads to a sharp drop in price that can trigger your stop-loss orders anytime.
If the price breaks below the support line of the pennant, this indicates that sellers are in control and a bearish reversal is imminent.
When Should You Enter a Trade?
As a trader, you should fully understand the risks involved whenever you enter the market.
Remember: trading is a zero-sum game - every winner takes some losses from the losers.
Therefore, you must avoid taking significant risks that may lead you to a severe loss in the long run.
The safest way to trade pennants is to wait for confirmation before you enter a long position.
Firstly, you want to make sure when a breakout occurs, the volume also surges significantly.
Second, you want to wait for the pattern to fully form, and the breakout candle must close above the flag formation.
These two powerful tips will help you avoid false breakouts (or bull traps) that usually happen at the end of a sideways trend.
There's always a chance that things could go wrong. So, you need to know how to protect your profits and cut your losses quickly when necessary.
What's a Bull Trap in Trading?
In technical analysis, a trap is a strategy used by market makers to lure unwary traders into a false sense of security where they can make profits easily without any risk at all.
A bull trap is simply a false signal indicating that the price is likely to move higher when in fact it does not.
Bull traps often occur at the end of a downtrend, when prices make a sudden leap. This leads many traders to believe that the price has bottomed out.
However, the price then quickly reverses direction and plummets, leaving the traders holding the bag with losing positions.
You will also see these traps during an uptrend, especially after a sideways period or a sharp pullback.
Traders become greedy and tend to buy more than they should. The buying pressure will result in a temporary price spike.
Make sure you are aware that the spike may be a false signal. This eventually leads to a sharp sell-off, as buyers are forced to liquidate their positions.
Bull traps can be created by a number of different technical indicators, and the most ideal one is the bullish pennant formation.
This is because it offers a good combination of bullish sentiment and strong beliefs that the market will keep going up - the two key ingredients of a successful bull trap!
Can You Tell The Difference?
Now we have several bullish trading patterns - all of which look quite similar in both appearance and price action.
So how can you tell them apart?
Bull Pennant vs Bull Flag
A bullish pennant is a technical analysis pattern that occurs after a steep advance in price. It is created by two trendlines that converge and form a small triangle.
The formation of a bullish flag is almost identical to the bullish pennant, except that it is formed by two parallel trendlines that form a small rectangle.
The flags and pennants share the same characteristics of a bullish continuation formation. If you're trading these patterns, your best bet is on the upside!
Bull Pennant vs Symmetrical Triangle
A symmetrical triangle is also a continuation chart pattern that occurs when prices consolidate between two converging trend lines.
You can easily confuse this chart pattern with the bull pennant - especially as the price action looks very similar in the consolidation phase.
There are three key differences between these patterns:
First, as mentioned above, the symmetrical triangle pattern often lasts much longer - sometimes several weeks or even months.
Second, this pattern can appear on both uptrends and downtrends, while the bullish pennant normally follows a prior uptrend.
Finally, the breakout direction of the triangle can be both upside and downside. This means you can look for either buy or sell setups, depending on the market conditions.
That's the reason why triangle formations have a lower winning percentage, and you should avoid if you don't like the guessing game.
Bull Pennant vs Bear Pennant
A bear pennant pattern is simply the mirror image of the bull pennant chart pattern. The only difference is that it is formed after a strong downtrend.
This half-staff pattern is created when there is a sharp decline, followed by a consolidation period. This is then followed by another plummet that makes prices sink to rock bottom.
The bearish pennant is typically seen as a bearish continuation pattern, as it indicates that prices are likely to fall further after the consolidation period is over.
The Bottom Line
There you have it - a complete guide to trading the bull pennant pattern.
You can consider this pattern as a strong bullish signal, as it indicates that the market is likely to continue its upward trend.
The target for this setup is set by measuring the height of the flag-pole, which suggests how far prices could rise if they break out from the pennant.
Breakouts from pennants often occur in the same direction as the initial move. So, if the market is in an uptrend, it's likely to keep rising.
Always make sure you wait for a clear break above the upper trend line before initiating your long positions.
A "reversal breakdown" can occur anytime if prices start to fall, breaking through the lower trend line.
This signals that the market momentum is shifting to the downside, and that prices will fall hard after a short pullback.
That's all I have for now - I hope this will help you make profitable trades with this powerful chart formation.

