The ascending scallop pattern is one of the most profitable chart patterns that I frequently use for day trading.
But for some reason, I still see many traders fumbling around trying to figure it out.
How many times have you been stopped out with a scallop formation? If you're like most traders, the answer is probably - way too many!
It's frustrating - I know you feel like you're putting in a lot of effort, but you're not making any progress whatsoever.
And the good news is, you can master this pattern without too much trouble - all you have to do is find the right trading strategy that works for you.
In this article, I'm going to teach you two simple strategies that you can use to catch a scallop every time it forms.
But most importantly, you'll learn the best way to start making consistent profits from trading scallop patterns.
Now let's get started.
What is a Scallop Chart Pattern?
A scallop chart pattern is a technical analysis pattern that signals a short-term continuation of a bullish trend.
It is created when prices make an upward-sloping curve that resembles the letter J on a price chart. That's why it's sometimes referred to as a J-shaped or J hook pattern.
During the scallop formation, prices move higher, retrace, and trade lower for a short period before reaching a new peak.
This indicates a short-term weakness of the ongoing uptrend and indecision in the market as to whether the trend will continue or not.
But if prices are able to hold above the retracement zone for a while, it implies a strong momentum behind the uptrend and a potential breakout of the resistance level.
The pattern is considered complete when you see prices break out above the key resistance level and rally to a new high.
Once the upward breakout occurs, it confirms the continuation of the prevailing uptrend and a positive outlook on the market for the near future.
There are two variations of this pattern: scallops ascending and inverted formations. We'll dive into each of them in the following sections.
Ascending Scallop Pattern
An ascending scallop pattern is a bullish continuation pattern that appears near the top of an uptrend.
It's characterized by a rising price trend, followed by a short-term retracement, and then another rise to form a higher peak. This creates a scallop shape on a stock chart.
You can notice that the upward move after a throwback is usually faster than the previous one, which adds to the bullish sentiment in the market.
This increase in momentum leads to more buyers entering the market, and the uptrend is likely to resume with a sustained move above the previous highs.
An upward breakout occurs when prices break up through the resistance trendline with rising volume.
Remember that the price action must close above this resistance boundary to confirm a valid breakout signal, otherwise, you may end up getting caught in a bull trap.
The bullish trend often continues after the breakout, though there could be some minor throwbacks along the way.
Now let's have a look at an ascending scallop example so you can easily identify this setup on a trading chart.
Example
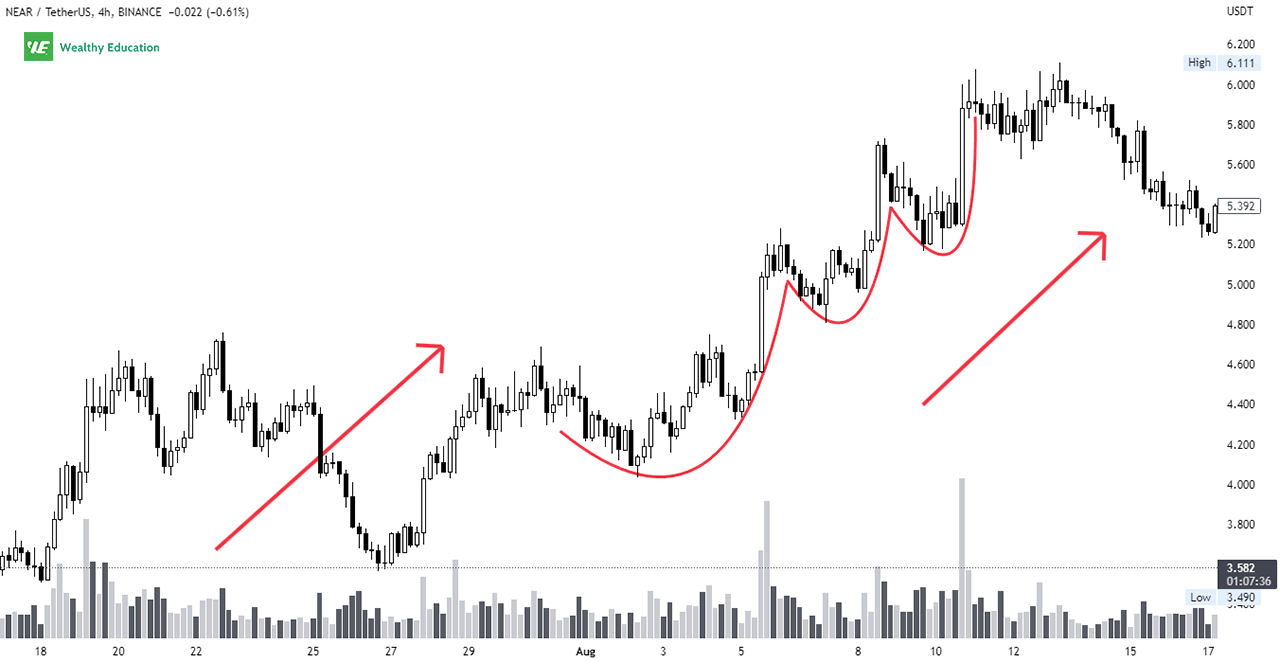
The example I'm showing you is of Near Protocol (NEAR/USDT) on the 4-hour time frame taken from TradingView.
As you can see on the chart below, the price was in an up-trending market leading to multiple ascending scallop formations.

Notice how each scallop was formed when prices moved higher with a rising volume trend.
You can see that each scallop was followed by a minor retracement, and then a spike up to a new high. This showed a sign of increasing buying pressure in the market.
Looking at these uptrend patterns, you could predict that the overall market trend was still bullish.
So every time the price broke up through a resistance trendline, you could enter a long position and ride the trend all the way up.
The uptrend continued until there was a sign of weakness when the volume started decreasing along with falling prices in mid-August.
Keep in mind that the market will not go up forever, and it will eventually correct itself at some point in time, and this is exactly what happened here.
So when trading the scallops, make sure that you'll pay close attention to the trading volume.
That's because it will tell you exactly what's going on in the market and whether the bullish momentum is still strong or not.
How to Trade Ascending Scallops
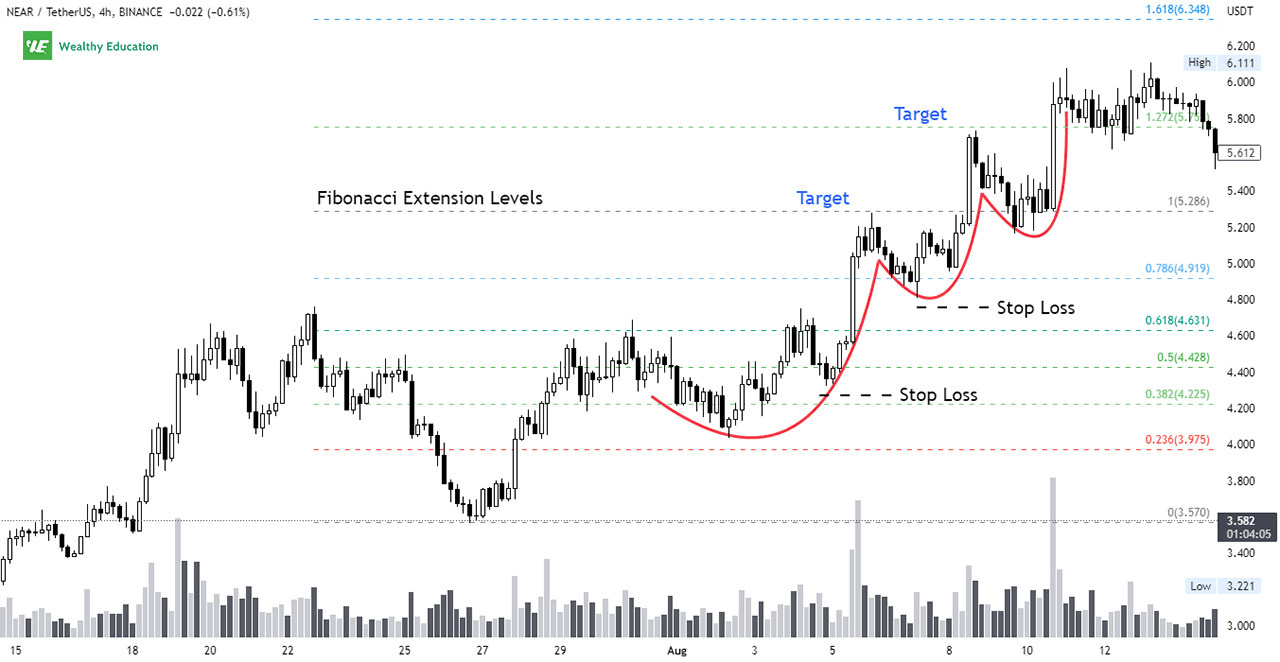
The ascending scallop trading strategy works like this: you can consider going long when prices break out above the resistance level.
The ideal entry for your buy order is just above the breakout point. But you need to ensure that the breakout candle must close above the resistance line.

And you need to make sure that there's enough buying volume to validate the potential uptrend.
You can set a profit target based on Fibonacci extension levels, or the previous horizontal resistance levels that you can find on the chart.
This is a short-term pattern, so you don't want to set the target price too far away from your entry point.
Otherwise, you'll end up turning your profitable trade into a losing one if the market reverses and goes against you.
You can place a stop loss slightly below the scallop formation to protect your account from an unwanted bearish reversal.
If you're looking to ride the trend, you can raise the stop loss higher (to your breakeven point) once the market moves in your favor.
Inverted Ascending Scallop Pattern
An inverted ascending scallop pattern is a short-term bullish continuation formation that occurs near the end of a bullish trend.
It's created by an uphill price run, followed by a temporary reversal, and then another run-up in price to a new high.
You can notice that the magnitude of the minor retracement is about half the height of the initial upswing.
When you find that the price drops and then stops at a support level, this means that the bulls are still in control, and they're willing to drive the price back up.
Therefore, this is a good sign to go long because you can see that buyers are strong enough to push the price up after the throwback.
If you want to play it safe, you can enter a long position after an upside breakout above the top of the inverted scallop formation ensues.
The breakout is confirmed when the price rises and closes above the resistance trend line for at least one day (if you're trading the daily chart).
If you're trading a lower time frame, you want to see the price staying above this resistance line for at least two candlesticks.
The resistance now becomes support, which means it can hold the price up for a while and provide sufficient momentum for the uphill run.
You want to make sure there's strong bullish momentum behind the price action to support the continuation of the uptrend.
Now let's consider a quick example so you can learn how to recognize this pattern on your own charts.
Example
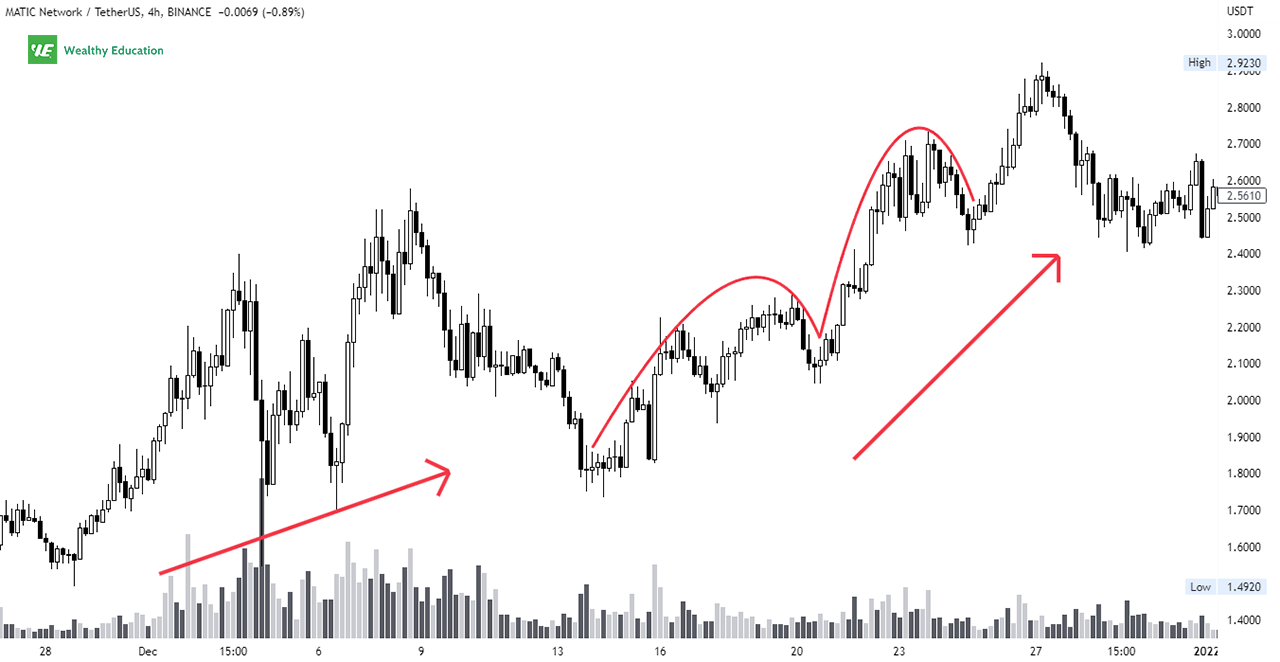
The example I'm sharing with you is of Polygon Blockchain (MATIC/USDT) on the 4-hour chart taken from TradingView.

As shown on the chart above, you'll notice that the price was in a rising price trend with two inverted and ascending scallop formations.
You can see that the inverted ascending scallop chart pattern was created by two uphill runs in price with a short-term retracement in between.
In this case, the corrective moves were slightly less than halfway through the prior upswing. But this was acceptable as long as support could hold the price firmly.
This was a sign of strength, and it indicated that there was still a lot of bullish momentum left in this market.
Once the bulls were back in the game, they pushed the price up quickly to the all-time highest high of $2.9237.
How to Trade Inverted Ascending Scallops
The inverted scallop trading strategy can be very profitable if you're patient enough to wait for the right setup to form.
The biggest mistake traders make is jumping in too early. But in order to catch a big move after the scallop forms, you have to wait for the throwback first.

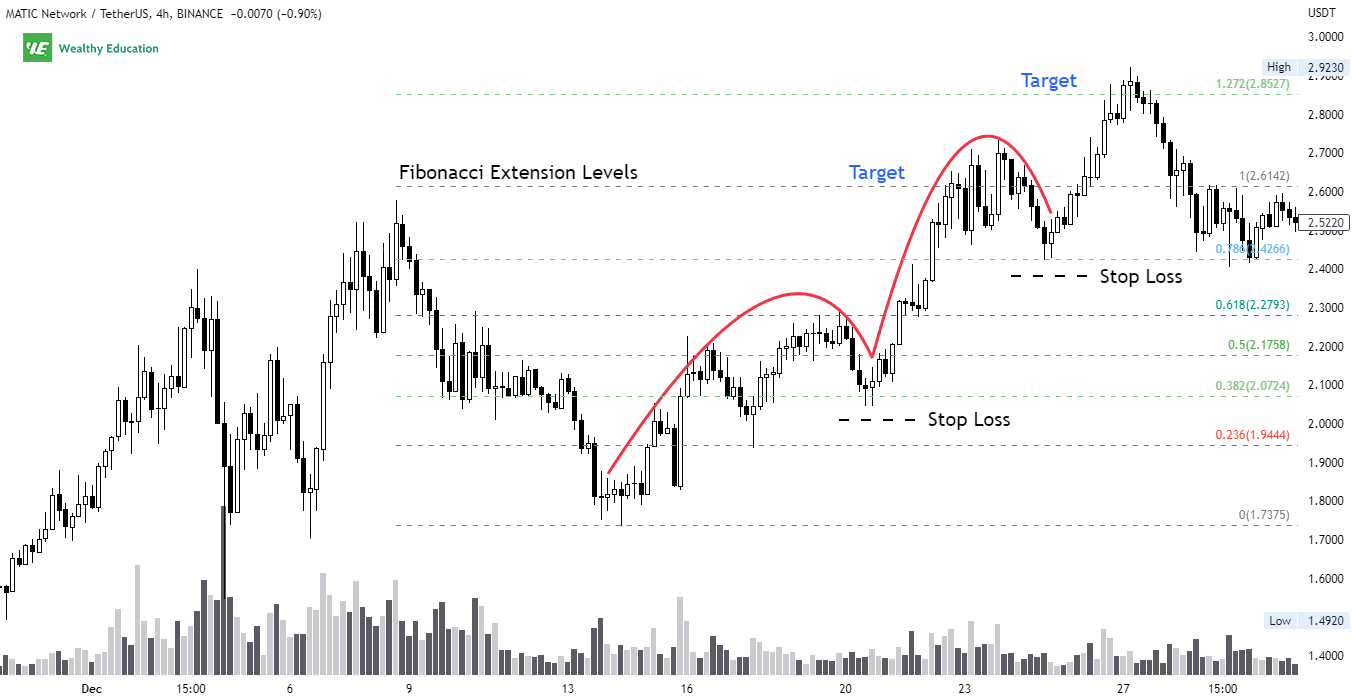
You can trade the long side after the price breaks out above the highest peak of the scallop formation. Therefore, your ideal entry point is just above the resistance trendline.
You need to ensure that the breakout candle must close above this horizontal line as well to confirm the validity of the pattern.
To lock in profits, you can set a profit target slightly below the previous key resistance level, or based on Fibonacci golden ratios.
Because the scallops ascending and inverted chart pattern is a short-term pattern, you don't want to hold on to your position for too long.
So make sure that you don't set your price target too high because there's no guarantee that the trend will continue indefinitely.
You can place your stop-loss order just below the recent throwback. Once the uptrend resumes, you can trail your stop loss higher and trade it alongside the trend.
Differences Between Scallops and Rounding Patterns
You can easily confuse the ascending scallop with a rounding bottom, and the inverted scallop with a rounding top.
But keep in mind that these patterns are different in the way they're formed and their outcomes in the market.
Rounding patterns are long-term reversal patterns, while scallops are short-term continuation patterns.
The ascending scallop occurs near the top of an uptrend, while a rounding bottom forms near the bottom of a downtrend.
The inverted scallop and rounding top both form near the peak of an up-trending market, but the breakout direction is opposite for each one.
That's why it's important to know how to distinguish these patterns from each other before you start trading them.
Summary
There you have it - the most detailed guide on how to trade scallop patterns profitably.
Now that you know all about them, it's time to put the knowledge into practice by testing them out on your charts.
Remember, the best trader in the world can lose all his money if he makes the wrong decision. So make sure you always trade with a stop loss to protect your capital.
To recap, scallops are created by an uphill price run, followed by a temporary reversal, and then another run-up to form a higher peak.
They indicate that the bull market is still intact and the upward trend is likely to continue in the near future.
If you want to make a safe trade, you can wait for the breakout candle to close above the resistance line and then take a buy position just above this level.
Your stop-loss and take-profit points can be set based on your risk-to-reward ratio, but make sure that you don't put them near your entry point.
Trade safe and good luck.

