If you're looking to trade a pipe pattern, you'll need a trading strategy that keeps you on the right side of the trend. And that's exactly what I'm going to teach you in this article.
You've probably heard about this very powerful chart pattern before, but you don't know much about it, do you?
Well, let me give you a little background - then I'll show you how you can use it to trade profitably.
Using bullish stock patterns like pipes and horns is a tried-and-tested strategy that has been perfected by many traders over the years.
It takes some practice, but once you get the hang of it, you can make a consistent profit from the market.
This article will introduce you to all the pipe reversal patterns, and teach you how to trade them for profit.
Now let's take a closer look at this pattern.
What is a Pipe Pattern?
A pipe chart pattern is a technical analysis pattern that signals a potential trend reversal, and a momentum change in an uptrend or a downtrend.
It's created by two adjacent price spikes, forming a "pipe"-like structure at a major support or resistance level.
The pattern consists of two price bars, which can be either green candle or red candle. It doesn't really matter.
These two bars can appear at any time of the trading day, but they are typically found at the end of an existing trend, and on longer time frames, such as daily and weekly charts.
This means that when you see this formation, you know that the current trend is going to end soon, and a reversal is around the corner.
The pipe candles signal a trend change - whether it's the end of a bullish or bearish move - and you can use this to your advantage when placing your trades.
If you're familiar with candlestick patterns, you can see that the pipe formation looks exactly like a tweezer candlestick.
It sometimes looks like a horn pattern, except that the pipe pattern does not have a small middle candle between the twin spikes.
Pipe Top Pattern
A pipe top pattern is a short-term bearish reversal pattern that occurs at the top of an uptrend, and looks like an inverted "Y" shape on the charts.
It's characterized by two consecutive upward spikes at the end of an uptrend, followed by a bearish reversal to the downside. This makes it look exactly like a tweezer top candlestick.
When trading the pipe tops, you should pay attention to the body of the pipe candles because that's what makes the pattern valid.
These two candles should be visually the same in size: they can be either long or short, but they should not have a large gap between them.
That's to say, one candle should overlap the other by at least 90% of its body, and they should both be roughly the same height.
The pattern is considered complete when the price closes below the low of the pipe.
Now let's have a look at a pipe top example.
Example
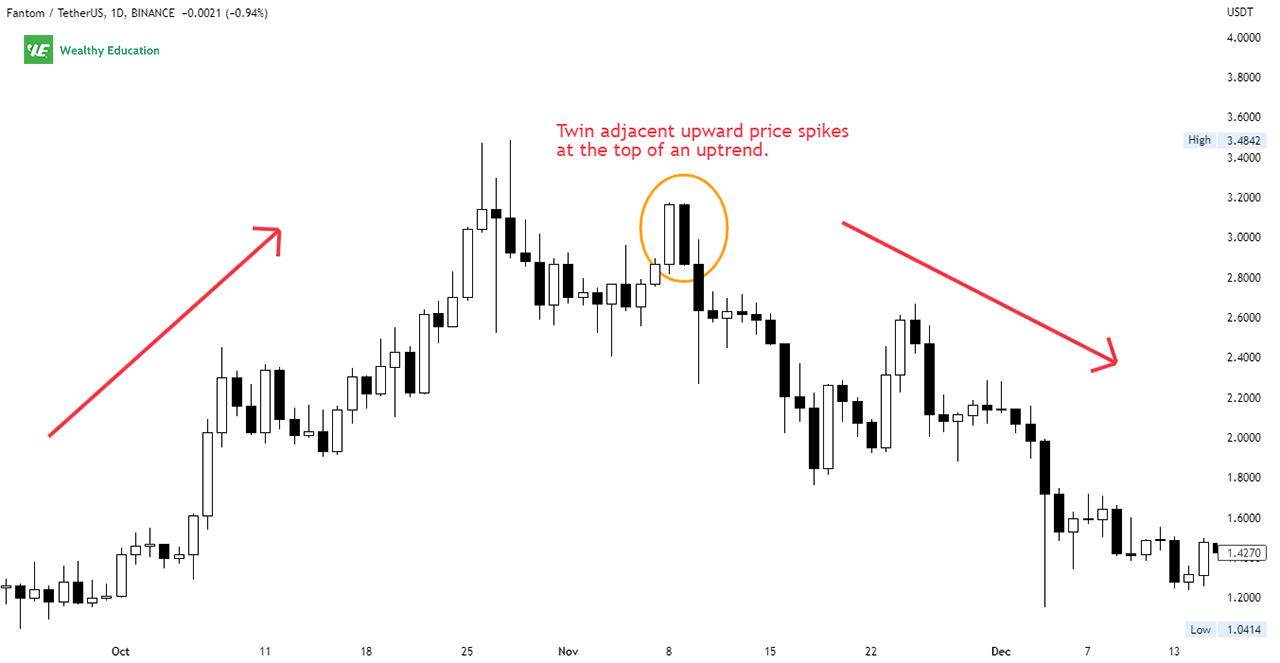
The chart below illustrates a pipe top formation on the daily chart of Fantom Blockchain (FTM/USDT), when it was on an uptrend for around 2 months.

The price went as high as $3.1593 in early November, but it started falling 2 days later after the pipe was formed.
Notice the size of these two candles: they were exactly the same, and they both had a body that overlapped each other by almost 100% of their heights.
As you can see, the price then declined by over 78% and reached a low of $1.7656 in just one week.
That's how powerful the pipe top chart pattern can be. It can give you a clear indication of an upcoming price drop in the market.
How to Trade Pipe Tops
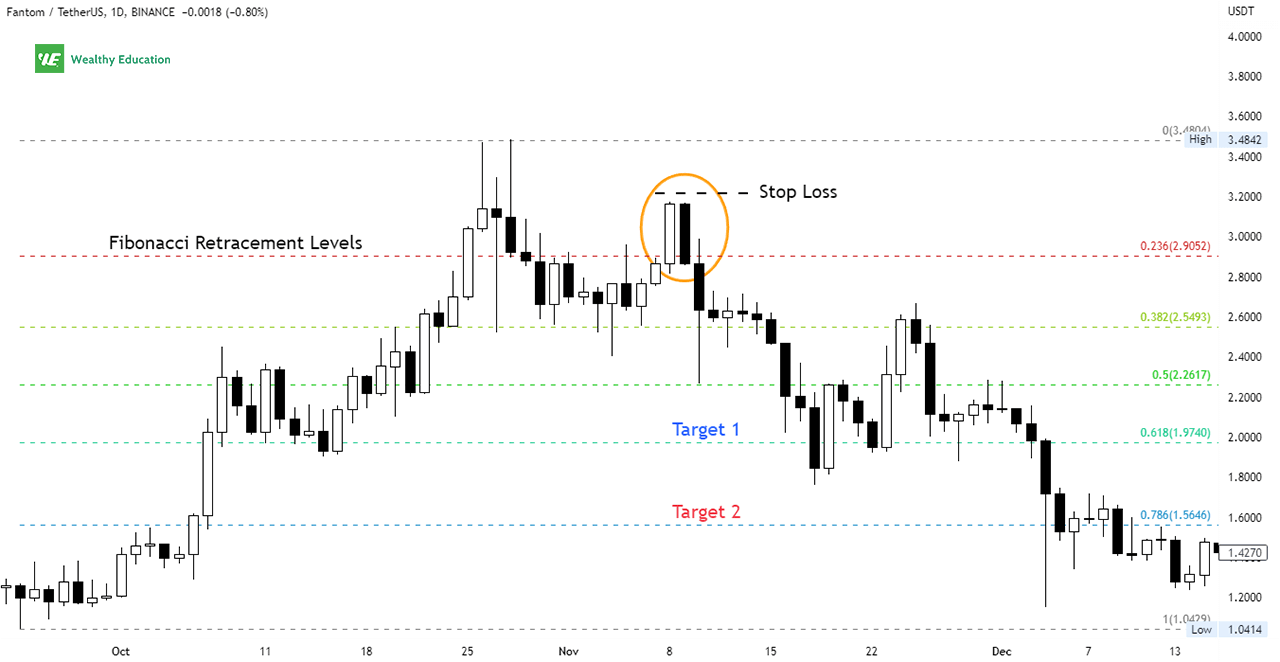
The pipe top trading strategy is to enter a short position immediately when prices close below the twin candles.
That way, you'll be in a perfect position to capitalize on the upcoming drop in the market.

Of course, you'll also want to place a stop loss order a few pips above the high of the twins to protect your account in case the market doesn't decline as expected.
You can set your target profit at whatever level you think makes sense - there's no standard rule for this.
Just make sure it's far enough away from the entry price so that your risk-to-reward ratio is not too big.
I personally use Fibonacci retracement levels as my favorite price targets. They're often accurate enough to give me a good reward-to-risk ratio for my trades.
Pipe Bottom Pattern
A pipe bottom pattern is a short-term bullish reversal pattern that appears at the end of a downtrend, and looks like a "Y" shape on the charts.
It's characterized by twin adjecent spikes near the bottom of a downtrend, followed by a reversal to the upside. This makes it look identical to a tweezer bottom candlestick.
Like with the pipe top stock pattern, the body of the two candles is what validates the pattern and gives us a clear signal about the direction of the market trend.
The pipe bodies should show a huge overlap between them: they should not be too short, and they should both be roughly of the same height.
Indeed, these two candles can be nearly equal or slightly taller than the other, but they must overlap each other by at least 90% of their heights.
In my experience, tall pipes tend to perform better than short ones. So you should look for tall formations only.
Prices must close above the highest high in the pipe bottom formation before the twin peaks become a valid pipe bottom.
Now let's consider a quick pipe bottom example.
Example
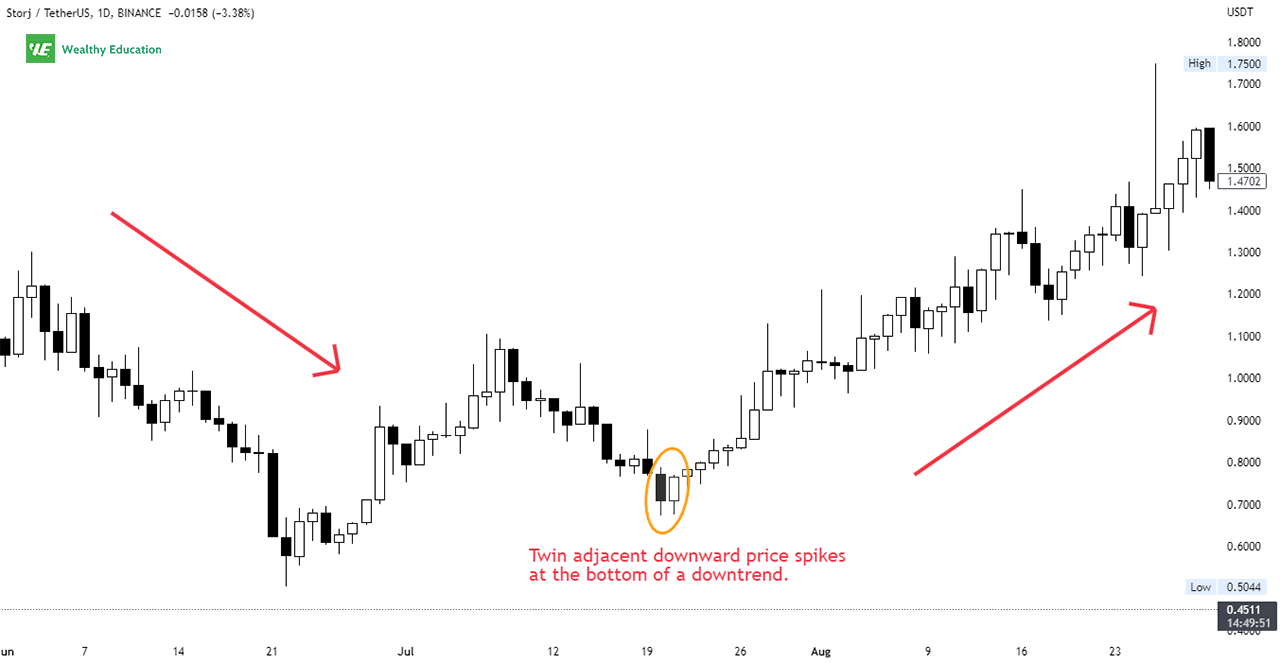
The pipe bottom chart pattern on the STORJ Token (STORJ/USDT) chart below shows a bullish trend reversal that took place in mid-July.

The price had been in a bearish trend for over a month from early May, but it started to rally 2 days after the formation of the pipe bottom.
Notice how the size of the two price bars was almost exactly the same: they had the same body, and they both overlapped each other by 90% of their heights.
The price then climbed by almost 214% to $1.4489 in just three weeks. Again, that's how powerful pipe formations can be.
They can clearly indicate a change in market trends and give you a strong trading signal to take the right action at the right time.
How to Trade Pipe Bottoms
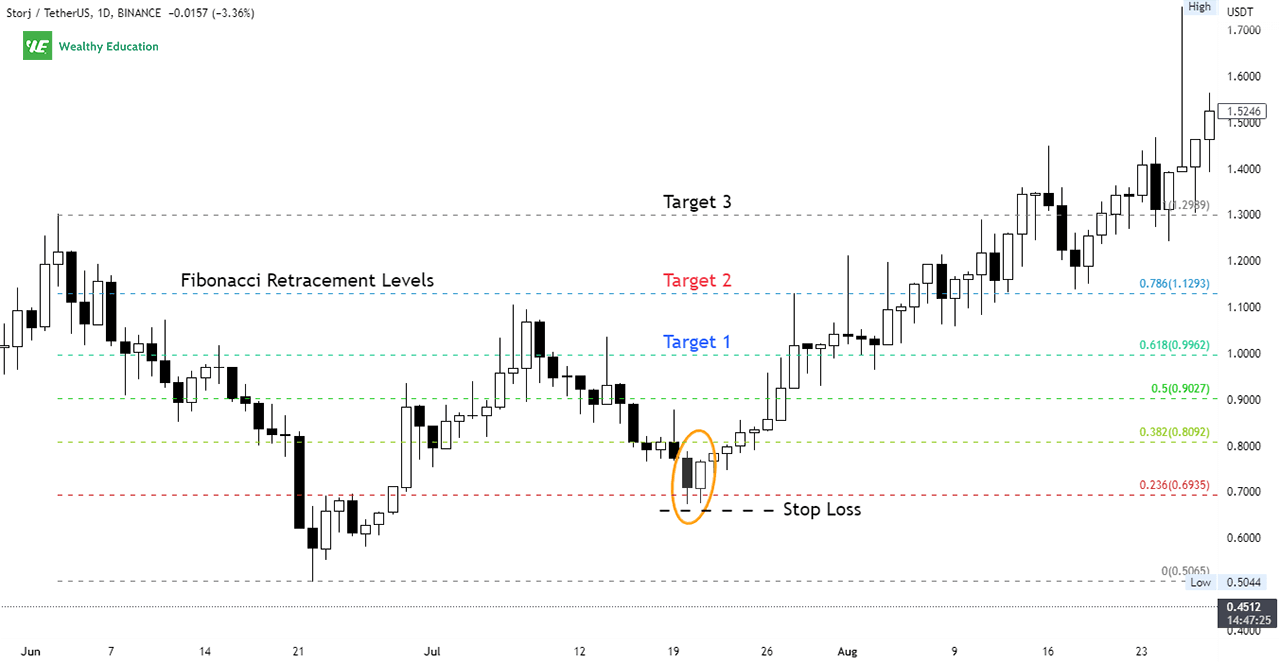
The pipe bottom trading strategy is to go long immediately when prices close above the highest high in the formation.

When trading the pipe bottom reversal pattern, all you need is a signal that will show you where the market is going next.
Keep in mind that if one candle is much taller or shorter than the other, the formation is considered invalid.
Like with the pipe top reversal pattern, you'll simply enter a long position once the price closes above the twin wicks, and set a stop loss below the lowest low of the pipe bottoms.
Placing this stop loss order will ensure that your trade will not be stopped out prematurely in case the market goes against you.
Your first target can be the next key resistance level, or Fibonacci golden ratio levels, depending on the chart you're trading on.
Pipe Pattern Trading Tips
Before you start trading a pipe stock pattern, there are several things you should take into consideration.
First, try to avoid trading pipe patterns during news events, or when the market is very volatile. Otherwise, you may end up getting stopped out in your trade.
Also, the pipe formation is a reversal pattern, so it's best to wait for the price action to close either above or below the twin candles before initiating a trade.
Remember, trade "what you see" and "not what you think". Don't try to guess what the market will do next because this is a good way to lose money.
You should wait for a clear confirmation before entering your trade to avoid making mistakes.
Therefore, it's better to be patient and wait for the perfect setup than to trade blindly and risk your money unnecessarily.
Finally, it's best to use other candlestick formations, and technical indicators like MACD and RSI, to confirm your trade setup before entering a position.
This way, you'll have a better chance of success, and won't risk too much of your capital on a single trade.
Summary
The pipe candlestick chart pattern is one of the most profitable reversal patterns that you could potentially find on the price charts.
It usually occurs at the end of a large move. In fact, it often forms at major support and resistance levels, which makes it a great trading opportunity.
As you can see, the pipe pattern trading strategy is pretty straightforward, and super easy to implement.
All you need to do is to wait for a breakout to occur, and then enter a position depending on the direction of the trend.
Keep in mind that the size of the pipe candles really matter. Ideally, they should overlap each other and have a roughly similar height as well.
If the two candlesticks do not overlap, or one is significantly taller than the other, then the formation is invalid.
You should also avoid trading a pipe top and bottom when the market is very volatile; otherwise you may get stopped out of your trades quickly.
Finally, it's important to wait for a clear confirmation before placing your trades because the pattern is reliable only when it completes.
You can combine this pattern with other reversal trading signals to increase your chances of finding a good entry point in the market.

