What you will learn in this post:
- A detailed case study on how to apply our value investing strategy to find highly profitable stocks.
- How I and my students easily made over 42.66% return on Texas Roadhouse's stock.
- How to perform both fundamental analysis and technical analysis the right way!
- A step-by-step valuation of Texas Roadhouse and how you can automate your valuation process.
- And a lot more...
I know it’s hard for you to start investing as you have no idea about where and how to start.
And it can be even harder for you to invest your money if you don’t have a SYSTEM…
You may have already read dozens of investing books and taken many investing classes, but if you don’t know how to apply the knowledge, you are wasting your time.
That’s why I want to make something that’s extremely practical for you.
In this case study, I’ll teach you exactly how we value a company from beginning to the end...step by step!
More...
I’m going to use Texas Roadhouse (TXRH) as an example because it’s a great value stock that we’ve invested in last year.
If you’ve taken our Advanced Value Investing course, you may have already known this company as I talked a lot about it.
I bought this stock at around $36, and sent out an announcement to our students when its price increased to about $37.

Its value went up quickly to over $42, and we made an easy return of 14% in only a few weeks.
Until now, the stock price has increased to about $51.36 a share - that’s an amazing return of 42.66% in just one year.
As you can see, with the right investment strategy, you can easily increase your wealth and multiply your money.
Now let’s dive into the case study. Don’t forget to take notes and click Share to support us.
Company Profile: Texas Roadhouse Inc. (TXRH)
Before doing the financial analysis and valuation of a company, you’ll need to spend some time taking a look at its latest financial highlights and other fundamental factors.
This step is really important as it helps you understand better the current financial performance of the business you’re investing in.
1. Business Snapshot
Texas Roadhouse Inc. (TXRH) is a leading business operating within the casual dining segment of the restaurant industry. The first restaurant was opened in 1993 in Clarksville, Indiana by the current CEO W. Kent Taylor.
Since then, this company has been dominating the restaurant industry with over 500 restaurants around the US and several overseas markets.
Their operating strategy is aimed at positioning each of their restaurants as the local hometown favorite for a wide segment of customers who are looking for fairly priced, full-service and high-quality meals.

Source: Nation's Restaurant News (NRN) - www.nrn.com
To achieve tremendous success in not only the US market but also many oversea markets, Texas Roadhouse has been concentrating on the following components:
As their slogan stated “Legendary Food, Legendary Service”, I love that Texas Roadhouse is a quality-oriented company as they pay much attention to the quality of their food, employees and customer satisfaction.
2. Financial Highlights
Texas Roadhouse’s total sales revenue increased by over 12.0% in Q3 2017 compared to their revenue in Q3 2016.
The growth in revenue was contributed by the opening of new casual dining restaurants with a rise in average unit volume (AUV), which was primarily driven by the company’s comparable restaurant sales growth.
Comparable restaurant sales and store weeks went up by 4.5% and 8.1%, respectively, at company restaurants in Q3 2017.

The business restaurant margin also increased about 10% during the period, while the restaurant margin as a percentage of restaurant sales slightly dropped to 17.8% from 18.1% in Q3 2016.
This decline was primarily caused by the increase in labor costs and a change in the company’s compensation structure.
However, the increase in labor costs were moderately offset by commodity deflation of nearly 2.0% led by lower food costs, especially beef.
Texas Roadhouse’s net income also went up by about 20.0% during this period thanks to a rise in restaurant margin dollars, moderately offset by an increase in general & administrative expenses and depreciation costs.
Diluted earnings per share (EPS) also raised by over 22.0% to $0.44 compared to $0.36 in the prior period.
3. Long-term Growth Strategies
Their core marketing strategies are designed not only to promote their brands, but also maintain a localized focus. They aim at increasing comparable restaurant sales by:
Texas Roadhouse strives for achieving these objectives through 3 main initiatives: local restaurant area marketing, in-restaurant marketing and advertising.

The business long-term strategies aim at increasing their net income and EPS and on top of that creating value for their shareholders. These objectives are accomplished by the following strategies:
The company’s management will keep assessing opportunities to develop Texas Roadhouse and Bubba’s 33 restaurants not only in existing markets and both also in both new international and domestic markets.
The company remains focused on managing restaurant investment costs and driving sales so as to retain their restaurant development in the future.
Texas Roadhouse is also looking to increase their profit margin by managing operating expenses and increasing restaurant sales.

To support the growth, the management will continue to make significant investments in their business infrastructure, including accounting systems, real estate, human resources, development of new restaurant concepts, legal, and marketing.
The company continues to pay dividends and assess opportunities to create more shareholders’ value through buybacks of common stock.
The company long-term strategy also includes increasing their regular quarterly dividend amount over time.
4. Business Risk Assessment
When evaluating a company, it’s important that you look into all potential risks that company may take. You can easily get this information by reading the company’s latest annual report and looking for the Risk Factors section.

Source: Texas Roadhouse Inc. - www.texasroadhouse.com
This is essential because if any of the uncertainties and risks actually happens, the business, especially its stock price, could be significantly affected.
Below is a list of potential risks associated with this company and the restaurant industry in general.
Risks Associated With The Company
Risks Associated With The Restaurant Industry
Other Potential Risks
Besides the mentioned risks, the company may be subject to other types of risks, including:
As you can see that through massive research, you can understand a lot about this company as well as the industry it’s operating in.
Keep in mind that risks that the company is taking are also the risks you will be taking when investing in its stock.
So make sure you won’t skip this step when performing your investment analysis.
5. Industry Overview
After considering risks associated with this company, it’s worth having a look at the restaurant industry as a whole.
Think about it this way…
When doing business, the first thing you need to do is to do a market research so you can understand the fluctuation of market trends as well as its competition.
This is the same for stock investing as you want to know how the market trends affect a company’s stock and how competitive the industry is.

This information will tell you if the company you’re investing in is capable of gaining market shares and competing with other industry peers.
For example, if the industry is highly competitive while the company can consistently generate high profit margins, it’s a sure sign that it has strong competitive advantages over its competitors and there’s a high chance that it can survive market downturns in the future.
At First Glance: Restaurant Industry
In terms of definition, restaurant businesses are retailers of prepared foods, and their results of operations are normally affected by a number of the same factors which also influence traditional retail companies.
Business models of restaurant companies are simple and easy to understand. However, because this industry is large and segmented, you’ll need to consider many factors when making your investment decisions.

Source: Top Restaurant Trends - www.creditdonkey.com
You should also keep in mind that the restaurant industry is intensely competitive due to consumers having a lot of dining options. Industry peers include everything from pizzerias and delis to fine-dining caters.
In addition, while there are some leading players in this large industry, especially among fast-food retailers, no single business has cornered the market.
Since different consumers prefer different dining options, restaurant meals are discretionary purchases and therefore the industry as a whole tends to be strikingly cyclical in nature.
Sales & Profit Margins
After learning about the industry’s competition, the next thing you’ll need to consider is how companies in this industry generate profits and improve their profit margins.
There are two ways that a restaurant company can increase their revenue:
Opening new restaurants is a primary way to drive revenue, especially when the company is in its early development stage. But it may become more and more difficult to generate profits when a restaurant chain grows in size.
Comparable-store sales, also known as “comps”, is a widely used metric to consider when evaluating restaurant companies. You’ll see this metric is mentioned a lot when reading the company’s annual report.
Comps will become more important when the business reaches its maturity, since they will be the main driver of growth.
Menu-price increases and product innovations are two essential ways to improve the company’s same-store sales.
Remodeling existing restaurants and frequently running promotions and limited-time offers are other ways to attract new guests and boost revenue.

When evaluating restaurant companies, you should take the dollar value of the average guest check into account, as this can tell you exactly what is bringing sales.
In this industry, management’s ability to offer a menu that appeals to a wide range of diners is an important factor to determine a restaurant’s profit margins.
Most restaurant businesses have operating profit margins (OPM) in the mid- to upper teens, and net profit margins (NPM) in the mid- to high-single digits.
Besides considering a restaurant’s revenue and net profits, you should also pay attention to other factors, such as food and labor costs, because they are major costs for service-oriented restaurants.
What I Learned About This Company At First Glance
The number one rule of value investing is that you should not put your money into something that you don’t understand. After doing intensive research, you should be able to describe the business in your own words.
In other words, if you still find it hard to explain how the business makes money and you still have no idea about the industry that business is operating in, then you should not make an investment.
Okay, now let’s summarize what we’ve found so far. Below is everything I’ve learned about Texas Roadhouse and its industry.
Describe The Business In My Own Words
Now that we have a better understanding about this company, let’s dive into the next section where we’ll dive deeper into its financial performance.
5 Compelling Reasons Why I Picked This Value Stock
As a rookie investor, I know you’ve had many troubles understanding how the stock market actually works.
It’s even harder when you have no idea about what you should do first when evaluating a company.
There are many reasons why I felt like investing in Texas Roadhouse. However, I’ll only go into the top 5.
This is because I don’t want to make this case study more complicated, and I want you to take away the most important parts, which will be useful for your investment journey.
Less is more - that’s right!
So now let’s find out the top 5 reasons why $TXRH has been a worthwhile investment.
1. It’s Had a Stable Operating Performance
After looking into Texas Roadhouse’s financial statements, I found that this company has a strong operating performance.

Net Income
In the previous section, we’ve learned that this year the company’s net income has raised by nearly 20.0% compared to the prior period.
But that’s not what actually matters...
The thing we need to pay attention to is the net income trend.
As you can see from the chart below, Texas Roadhouse’s net income has been increasing consistently over the past 5 years.
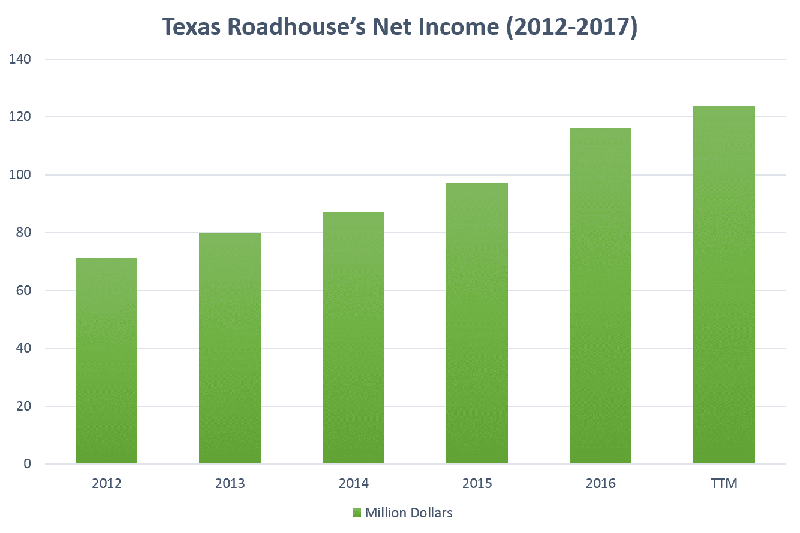
I realized that in the period from 2012 to 2016, the company’s net income increased by 63.0% from $71 million to $116 million.
Year | 2012 | 2013 | 2014 | 2015 | 2016 | TTM |
|---|---|---|---|---|---|---|
Net Income (in millions) | 71 | 80 | 87 | 97 | 116 | 124 |
% Change | 100% | 113% | 123% | 137% | 163% | 175% |
In other words, the company had achieved an annualized net income growth rate of about 13.0%.
Sales Revenue
In my investing courses, I’ve been talking a lot about the relationship between a company’s sales revenue and its net income.
A simple rule is that if you find that there was an increase in net income, the revenue should increase as well.
Taking a look at the chart below, you’ll see a consistent revenue growth trend over the past 5 years.
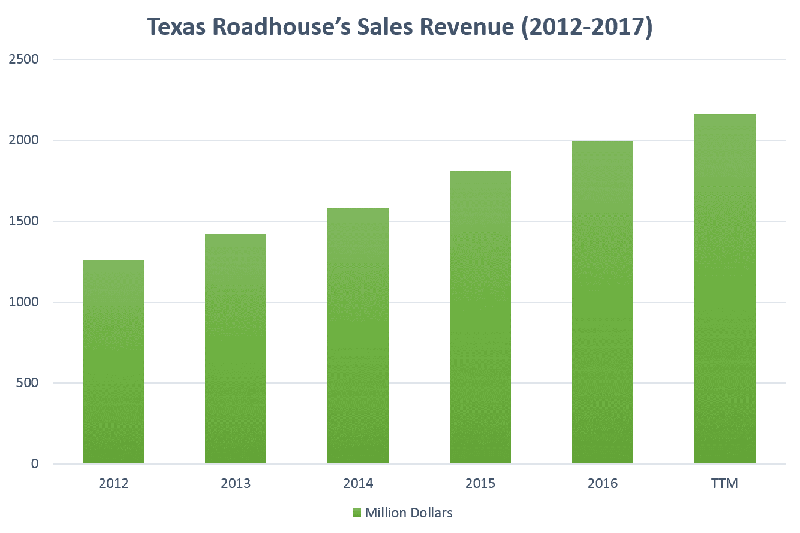
From 2012 to 2016, the revenue increased by 58.0% to nearly $2 billion - that’s an annualized revenue growth rate of 11.6%.
Year | 2012 | 2013 | 2014 | 2015 | 2016 | TTM |
|---|---|---|---|---|---|---|
Sales Revenue (in millions) | 1,263 | 1,423 | 1,582 | 1,807 | 1,991 | 2,159 |
% Change | 100% | 113% | 125% | 143% | 158% | 171% |
The growth in both net income and revenue tells us that the company’s management has been doing a great job in boosting their company’s sales and generating more profits.
Cash Flow From Operations (OCF)
Most investors fall into a value trap because they only care about how much a company makes, and they tend to ignore the importance of assessing cash flows.
If you want to draw a clear picture of a company’s operating performance, evaluating the net income and revenue is not enough. You’ll need to pay attention to its operating cash flow as well.
Looking into Texas Roadhouse’s cash flow statement, I found that its net cash from operating activities has been consistently on the rise over the last 5 years.
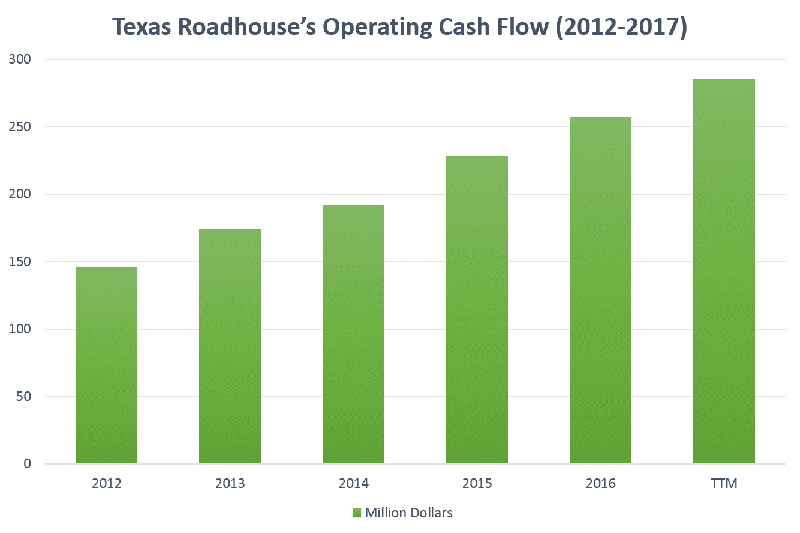
In the period from 2012 to 2016, the cash flow from operations increased by over 76.0% from $146 million to $257 million.
Year | 2012 | 2013 | 2014 | 2015 | 2016 | TTM |
|---|---|---|---|---|---|---|
Cash Flow (in millions) | 71 | 80 | 87 | 97 | 116 | 124 |
% Change | 100% | 119% | 132% | 156% | 176% | 195% |
It’s interesting that the company’s OCF has grown even faster than the revenue and net income at an annualized growth rate of over 15.0%.
Earnings Per Share (EPS)
Now let’s look at the earnings per share. You can easily find this figure reported on the company’s income statement.
As you can see that Texas Roadhouse’s EPS has been consistently increasing over the past 5 years.
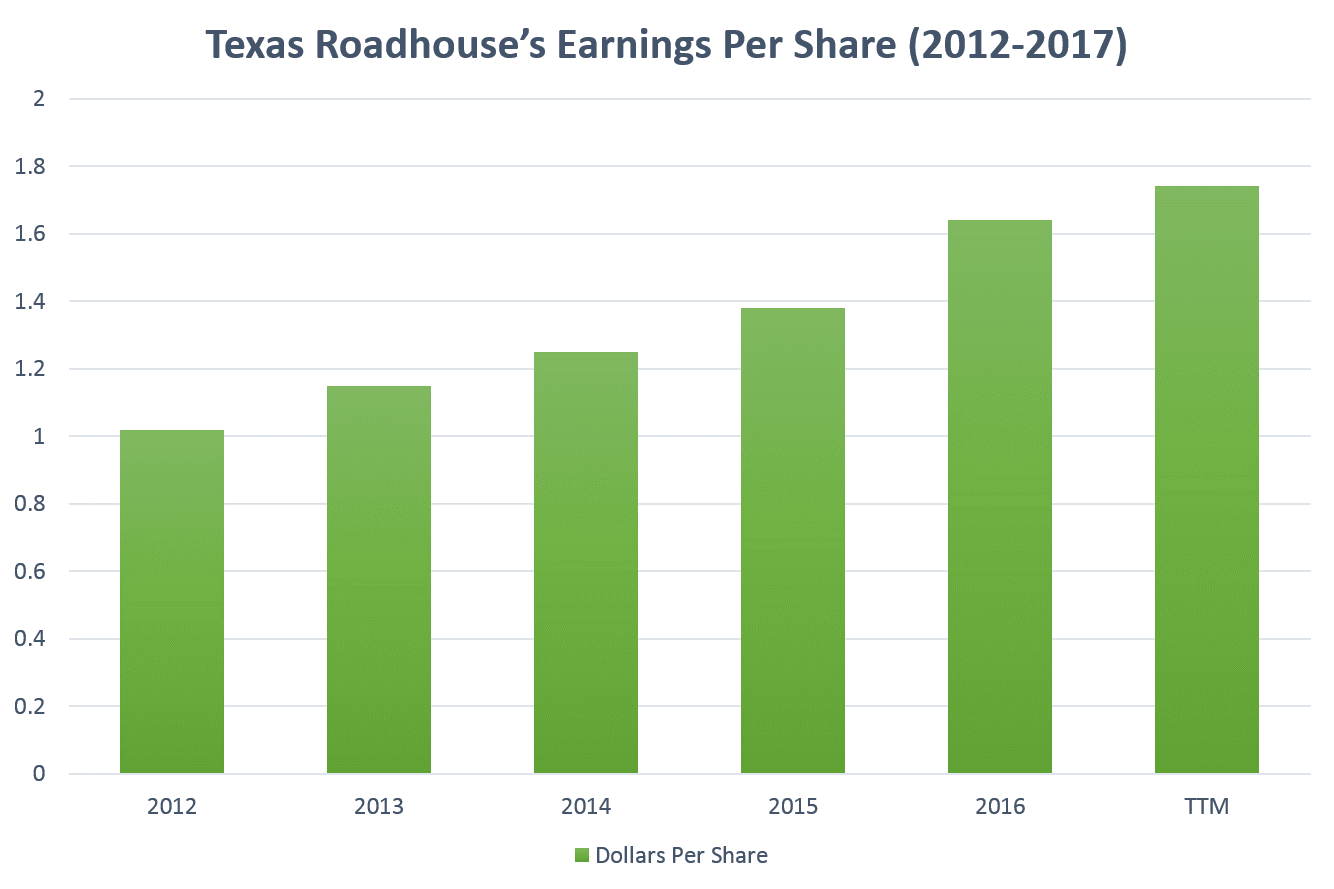
This shows that if you invest in this company, you will be able to make more and more profits for every share you own every year.
Year | 2012 | 2013 | 2014 | 2015 | 2016 | TTM |
|---|---|---|---|---|---|---|
EPS | 1.02 | 1.15 | 1.25 | 1.38 | 1.64 | 1.74 |
% Change | 100% | 113% | 123% | 137% | 163% | 175% |
Now let’s compare the company’s quarterly EPS:
EPS reported on September 2016 | EPS reported on September 2017 |
|---|---|
$0.36 per share | $0.44 per share |
Percentage Change in EPS: 22.2% | |
The company’s EPS increased by over 22.0% in Q3 2017 compared to their EPS in Q3 2016.
The result is amazing as it tells us that Texas Roadhouse is very efficient in using its capital to generate more income.
Return on Equity (ROE)
The next thing that I’m going to talk about is the company’s return on common shareholders’ equity ratio.
As a value investor, evaluating the ROE figure is very important as this tells you how effectively a business is using your capital to generate profits.
Year | 2012 | 2013 | 2014 | 2015 | 2016 | TTM |
|---|---|---|---|---|---|---|
Return on Equity (ROE) | 14.00% | 14.45% | 14.56% | 15.17% | 16.28% | 15.91% |
Source: Morningstar.com | ||||||
In addition, by looking at the ROE, you can easily determine how efficient the company’s management is at utilizing your money to maintain their current operations as well as fund their future expansion.
As you can see from the table above, the ROE has remained consistently high (over 14%) in the last 5 years. This indicates that Texas Roadhouse is a very profitable company.
2. It’s been a Low-debt Company
One of the top reasons why I invested in Texas Roadhouse’s stock is because it’s a low debt company.
In fact, having debt is not a bad thing as it helps the business fund their growth and expansion easier.
But having too much debt can lead to many financial issues, especially when the interest partially or fully eats up the company’s cash flow and profits.
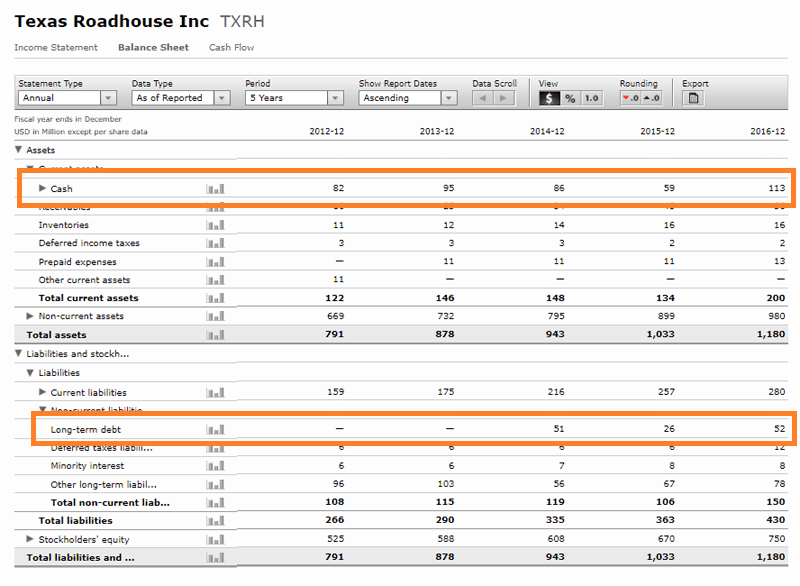
Looking into Texas Roadhouse’s balance sheet, I found that the company’s current cash balance was even higher than its long-term debt.
Source: Morningstar.com
This is a very good sign as it shows you that the company could easily pay off its long-term liabilities by only using cash, and it wouldn’t have to sell any assets to pay off the debt.
How about its short-term debt repayment capacity? Now let’s take a quick look at the company’s current ratio.
Year | 2012 | 2013 | 2014 | 2015 | 2016 | TTM |
|---|---|---|---|---|---|---|
Current Ratio | 0.77 | 0.83 | 0.68 | 0.52 | 0.72 | 0.69 |
Source: Morningstar.com | ||||||
As you can see that the current ratio has remained lower than 1.0, this indicates that the company might have troubles paying off its short-term debts by using its current assets.
3. This Stock Was Undervalued
After looking into a company’s financial performance, the next thing you want to do is to make sure it’s undervalued.
In other words, you want to invest in a company that is currently selling well below its intrinsic value.
The process of calculating intrinsic value is quite complicated, but it won’t be a problem when you get familiar with the whole process.
6 Steps to Calculate Intrinsic Value
There are 6 steps you’ll need to follow:
If you still have no idea about how to calculate intrinsic value, you can follow my step-by-step guide here.
Below are financial data of Texas Roadhouse as of the time I bought this stock:
Now let’s calculate this company’s intrinsic value together.
Calculate Discount Rate (WAAC)
To find the company's discount rate, you can follow the 5 simple steps below:
Step 1: Calculate Cost of Debt (Rd)

Step 2: Calculate Weight of Debt (Wd)

Step 3: Calculate Cost of Equity (Re)

Step 4: Calculate Weight of Equity (We)

Step 5: Calculate Discount Rate (WACC)

Calculate Discounted Free Cash Flow (DFCF)

Calculate Net Present Value (NPV)
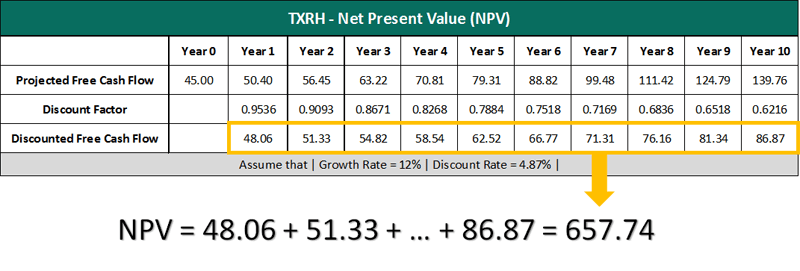
Calculate Terminal Value (TV)

Calculate Intrinsic Value (IV)

I bought this stock at about $36 in early 2016. At this time, its intrinsic value was about $51.
As you can see that the intrinsic value per share was much higher than the share price. So I’d come to a conclusion that the stock was undervalued.
If you find it hard to calculate intrinsic value yourself, I’m super excited to let you know that all of your headaches will be gone…FOREVER!
That’s because I and my team have developed an Intrinsic Value Calculator for you. This tool will help you save time and energy by automating your entire stock valuation process.
All you need to do is key in several numbers into the calculator, and then you’ll instantly get an intrinsic value of $51.81.
4. The Stock Achieved a Value Score of 71/120
After performing fundamental analysis of Texas Roadhouse, I used the Value Investing Scorecard to double check to see if this company was actually worth investing in.
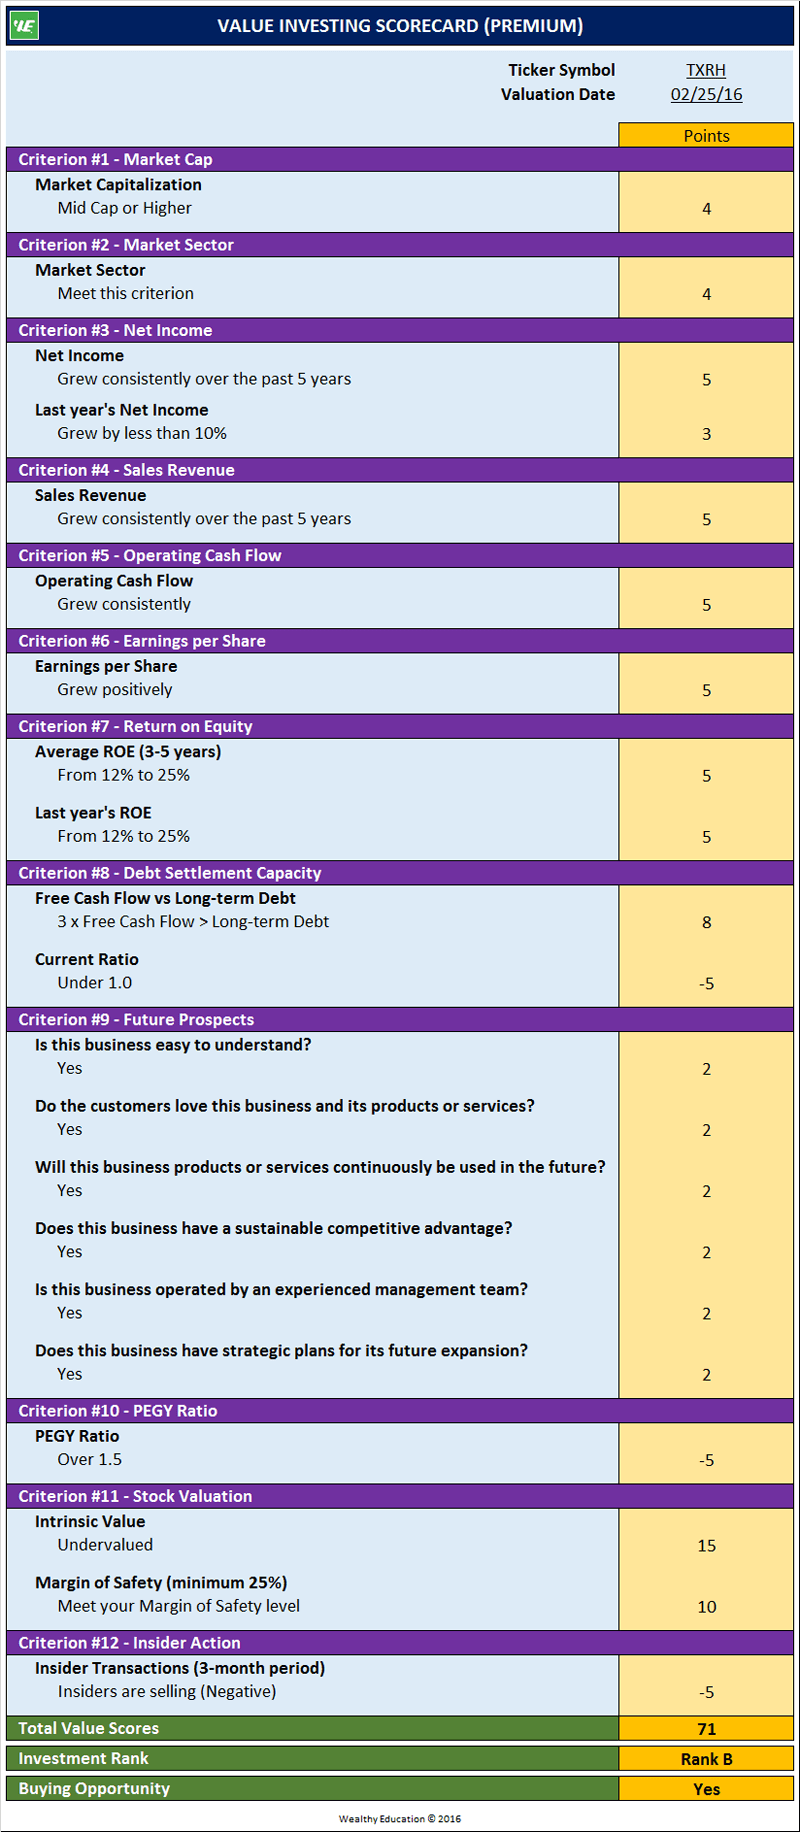
As you can see that $TXRH achieved a value score of 71/120, which is considered a fair investment.
FYI, the Value Investing Scorecard was developed by our team to help you not only make easier investment decisions, but also automate your fundamental analysis process.
This tool helps you score stocks based on their current financial performance by using our proven investment criteria.
We use a new valuation metric called “Value Score” to determine if a stock is fundamentally strong.
You see, with this metric, you can easily know whether or not a company is a great value stock.
5. It Was in an Uptrend
Most value investors make the same mistake that they often make their investment decision based solely on fundamental analysis.
The fact is that using fundamental analysis alone is not enough...
Fundamental analysis focuses on covering topics like the company’s management, the industry they operate, the products or service they sell.
This technique also focuses on examining the company’s financial statements to help you understand better their current financial performance.
However, the problem is that most of your fundamental research is based on “projections” and a large portion of financial data is provided by the company’s management.
And the thing is financial data can be misleading (intentionally or not).
In other words, there are many techniques a company can use to cook their book and make their financial statements look “beautiful” in your eyes.

In addition, a great stock can become a bad investment if you buy it at the wrong time.
That’s why before making my investment decision in this company, I’d want to confirm that it was currently in an uptrend.
I used the simple moving average crossover strategy to analyze the current trend of this stock.
If the SMA 60 line crossed above the SMA 180 line, and both lines slope upward, there would be potentially an incoming uptrend and this stock was going to make me some good money
And guess what...I was right!
After I bought this stock, its value quickly jumped from about $36 to over $42 a share in just a few weeks.
If you had joined our investing training courses and bought this stock at around $37, you could’ve made over 14% return in less than a month.

Until now, the stock price has increased to over $50 a share - that’s an amazing return of over 40% in just one year.
The Bottom Line
There you have it - an “uncensored” guide on how to apply our value investing strategy to find profitable stocks.
I hope this case study will help you become a better investor.
You can also join our investing training programs if you want to keep yourself updated with new investment tactics that I and my students are using to build and multiply our wealth.
If you have any questions for me, feel free to leave a comment below or simply shoot me an email.
And don’t forget to click Share to support us.
Have a great day!


