If you have no clue about how to trade the broadening wedge chart pattern, don't worry - you're not alone.
The broadening wedge is created by a battle between the bulls and the bears. The bulls are trying to push the price up, while the bears are trying to push the price down.
The gap between the upper and lower trend lines grows quickly as the price moves sideways. That creates the "broadening" part of the name for this formation.
Many traders enter the market too early and end up losing money. Keep in mind that if you trade with the trend, you risk being on the wrong side of a rally or sell-off.
In this article, I'll explain the most common pitfalls that traders face when trading these patterns, including some reasons why they are suitable for all investors and why they don't always work out.
Now let's get started!
What is a Broadening Wedge?
The broadening wedge is a bilateral chart pattern that you can use to spot potential breakouts (if the market is trending) and short-term trend reversals.
It is created by drawing two diverging trend lines that connect a series of price peaks and troughs.
The formation is considered complete when the price breaks outside the megaphone shape.
The trend is usually sideways within the expanding wedge pattern.
However, breakouts can occur in either direction, so you need to be prepared for both scenarios.
If you are bullish on the security, you can go long when there's an upward breakout and the price closes above the upper trendline.
If you're bearish, you can wait for a downward breakout to occur before taking your short position.
No matter what your level of experience, the expanding wedge can be a valuable tool in your trading arsenal.
If you are just starting out, you can use this pattern to help you identify potential reversal trading opportunities.
If you are a more experienced trader, it can help you time your entry and exit points.
Is Broadening Wedge Pattern Bullish or Bearish?
The great thing about the widening wedge pattern is that it can be both bullish and bearish, regardless of the time frame.
However, you will need to stay flexible until the formation fully develops.
When trading this pattern, it is also important to keep an eye on the volume levels.
The formation is only considered valid if the volume levels are decreasing as the price moves higher.
This is a warning sign that the buyers are losing interest and that the trend is going to reverse.
If the trading volume increases along with the price, this indicates that the momentum is still strong and the previous price trend is likely to continue.
Volume levels will then rise significantly upon a breakout (either upward or downward).
If you see a widening formation on a chart, I would recommend you wait for a confirmed price action before making your trading decisions.
This will help you get in the market at the right time and avoid getting caught in bull and bear traps.
Formation
A broadening wedge formation is made up of three sections:
- The narrowing phase: This is where the upper (resistance line) and lower (support line) lines begin to diverge.
- The buildup phase: This is where price begins to move sideways within the wedge.
- The breakout phase: This is when the wedge breaks downward or upward.
The extending pattern is created when there is a shift in the balance of power from the bears to the bulls.
This shift typically occurs after a period of consolidation or range-bound trading.
The break-out from the wedge formation is often accompanied by an increase in trading volume, which can confirm the strength of the move.
This pattern can take a long time to form, so patience is your key to success.
Now let's dive into some variations of the broadening wedges.
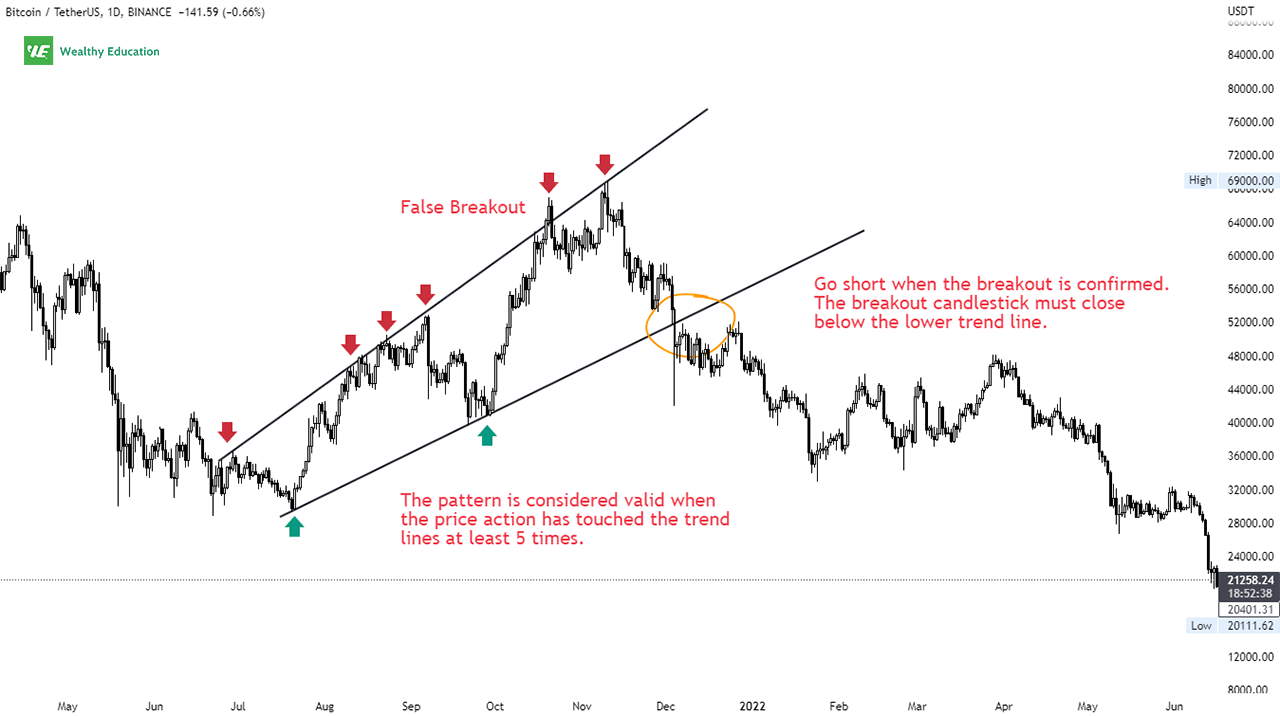
Ascending Broadening Wedge Pattern
The broadening ascending wedge pattern is created by drawing two up-sloping lines that connect a series of higher highs and higher lows.
The pattern keeps sloping up as the price rises towards the upper trendline.
The price will usually trade within the wedge until it breaks to either the upside or downside.
Descending Broadening Wedge Pattern
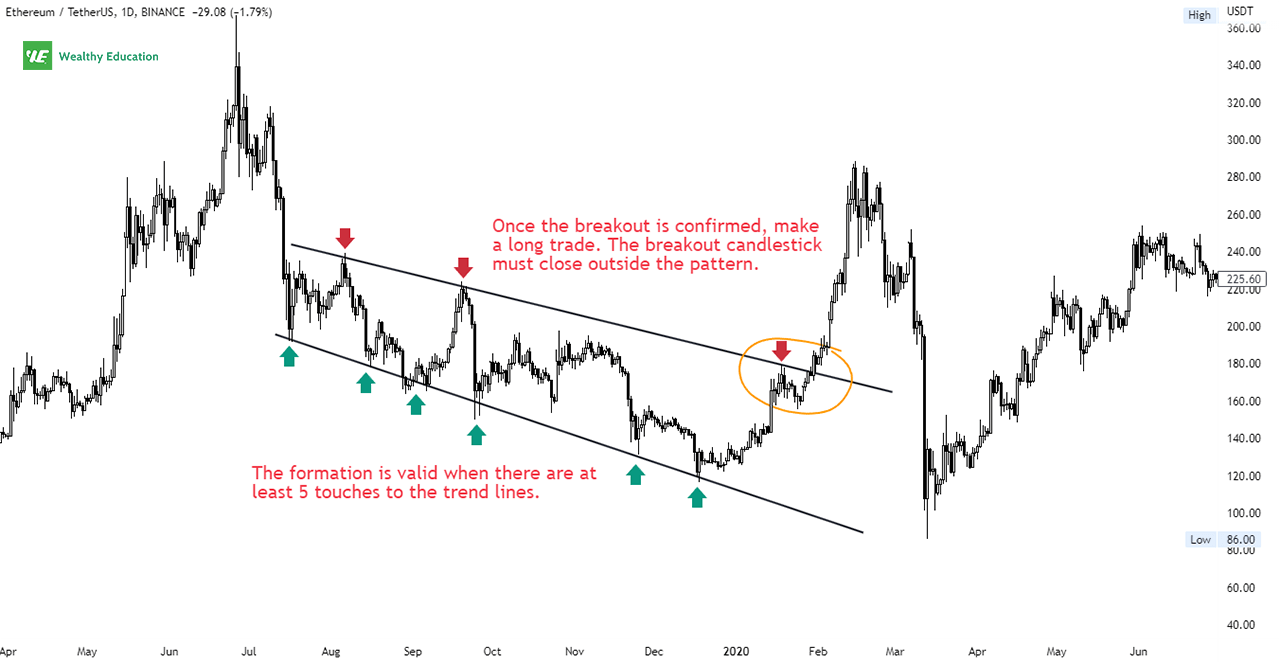
The broadening descending wedge pattern is formed by two diverging lines that connect a series of lower highs and lower lows.
This pattern is similar to any other symmetrical broadening wedges. The only difference is that it slopes downwards as the price moves lower.
The falling broadening wedge can be bullish, bearish or neutral, depending on the direction of the breakout.
Right Angled Broadening Wedge Pattern
Last but not least, we have the right-angled broadening wedges.
This formation is created by two trendlines that diverge from each other and form a right angle.
As the name suggests, the pattern looks like a triangle that is extending over time.
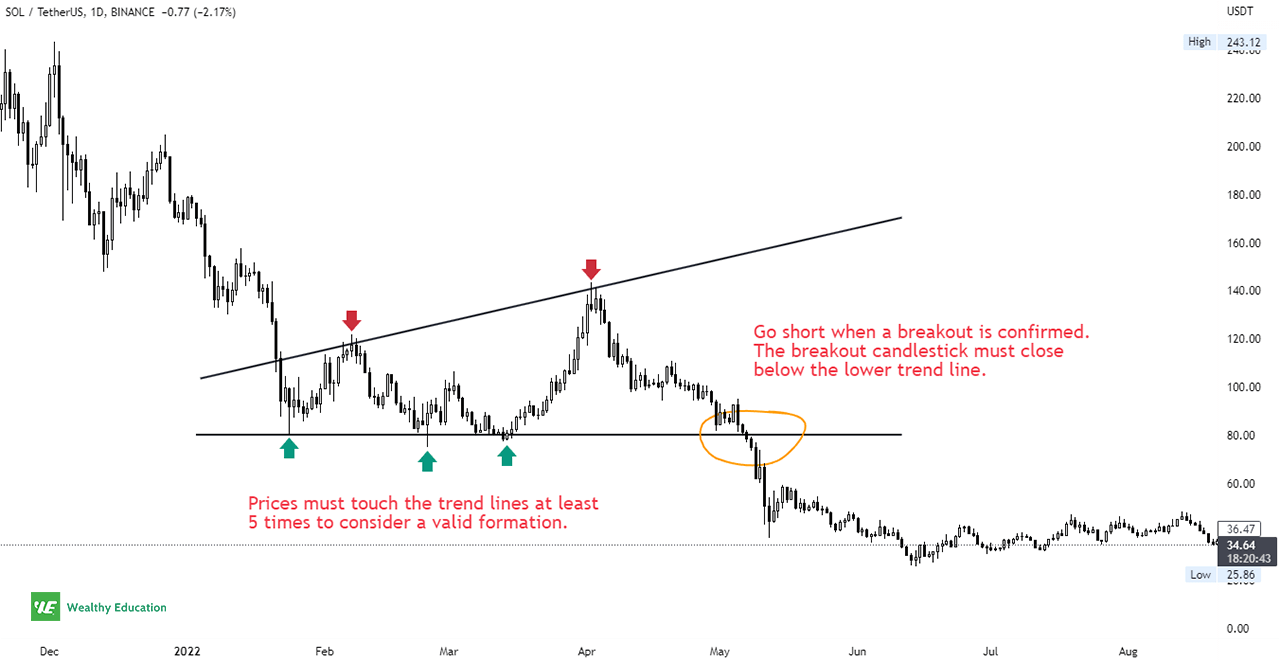
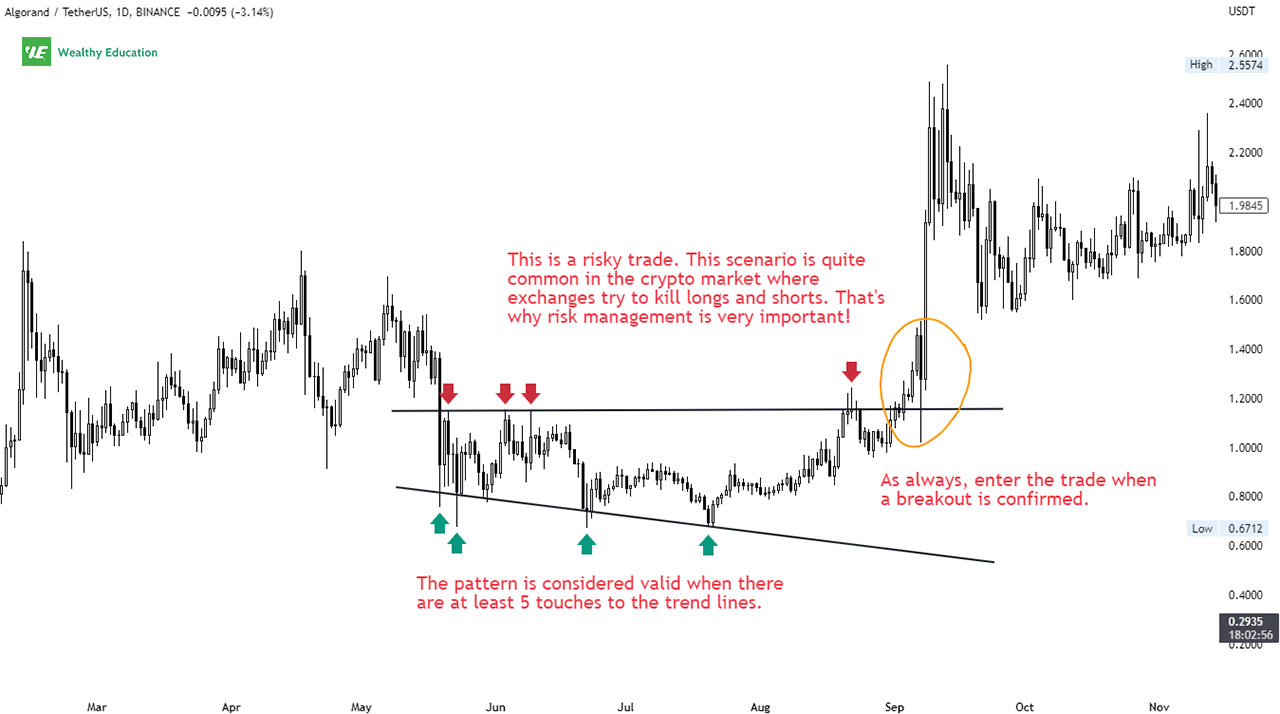
The horizontal trend line can act as a support or resistance level, depending on where the formation appears on a chart.
This right-angled ascending broadening wedge is characterized by a horizontal bottom and an up-sloping trendline, as shown in the chart below:
On the other hand, the right-angled descending broadening wedge consists of a horizontal top followed by a down-sloping trendline.
Example
The trading range can be measured by using trend lines.
The safest way to trade chart patterns is to wait for price action to break through one of the trend lines and make a trade accordingly.
The key levels to watch are support and resistance levels.
The support is the level where the buyers are likely to step in and start buying the security.
The resistance is the level where the sellers are likely to step in and start selling the security.
Now let's take a look at a quick example:
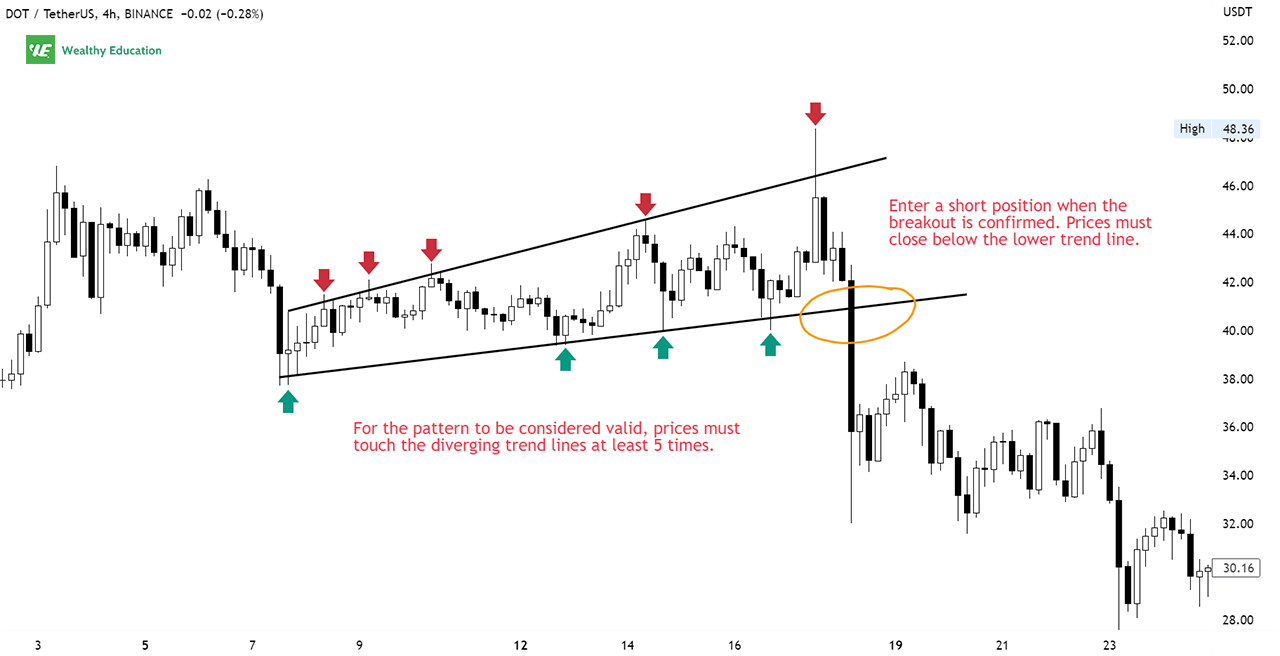
As you can see, the prices tried to break the top trendline but failed, hence forming a shooting star candlestick on the chart.
It is a clear signal that the resistance was so strong that the price couldn't break through it.
Because the trend was losing steam and a reversal was likely to occur, we could look for a short entry when the price broke outside the formation.
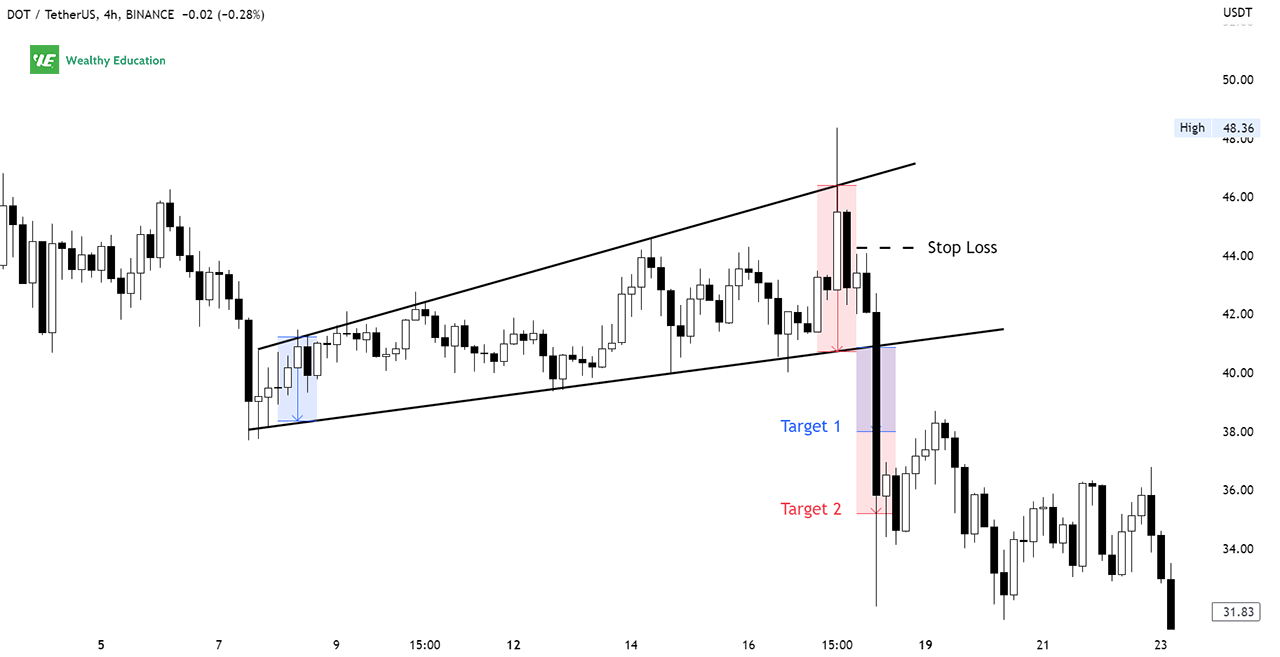
We would enter the market when the broadening wedge breakout occurred. The target for this trade could be the same as the height of the wedge.
A long breakout candlestick shows that bearish sentiment was gaining momentum, and a strong downtrend was likely to follow.
Even if this is an ideal setup for a short position, don't forget to place a stop loss to limit your risk in case the market goes against you.
Trading Strategy
Broadening wedges are difficult to trade for a number of reasons.
First, the pattern is prone to false breakouts.
Second, it is difficult to spot on a chart.
Third, the formation can take a long time to develop, which can lead to frustration for traders who are trying to trade it.
So how do you trade a broadening wedge?
The first step in identifying this pattern is to look for a series of highs and lows.
This can be seen on a price chart as a series of peaks and troughs that are all moving in the same direction.
Once you have identified this series, you will then need to look for the divergence between the highs and lows.
The next step is to identify an entry point for your trade. The rule of thumb is to wait for the price to break the trendlines before taking a position.
Your profit target points can be found by taking the height of the pattern and adding it to the entry price.
However, beware of bull and bear traps (aka "fakeouts" or "head fakes")
Ascending and descending broadening patterns are difficult to trade because they are prone to fakeouts.
This is when the price breaks out of the wedge in one direction, only to reverse and move back inside the wedge.
Therefore, you should wait for a pullback before entering a trade or trail your stop loss to breakeven.
5 More Useful Tips to Achieve Your Profit Target!
If you find it difficult to trade this chart pattern, make sure you follow these useful tips:
- Look for a strong trend. The ascending or descending broadening wedge forms when the market is in a strong uptrend or downtrend. This makes it easier to trade the pattern if you can identify the trend beforehand.
- Enter your trade when the pattern is confirmed. Don't enter too early, or you could get caught in a fakeout. Wait for the market to confirm the pattern before entering your trade.
- Always place your stop loss! This will help you manage your risk and protect your profits.
- Take profits when the market breaks out of the wedge. You can exit your trade when the market breaks out of the upper trendline or when it reaches the first price target you've set.
- Don't forget to practice on a demo account until you get comfortable with the pattern.
Summary
As with all broadening patterns, you should remember that the market direction can be up, down or consolidating.
In fact, they are more of a reversal pattern. That's to say, after an extended move in one direction, they tend to mark a significant change in direction.
This is why many technical analysts view them as potential turning points in the market.
When we trade broadening formations, we have no choice but to break.
The best way to trade is to wait for a breakout in either direction and then trade with the trend.
If the price breaks out to the upside, you would go long. If the price breaks out to the downside, you would go short. It's that simple.
Make sure you never try to second-guess the market. Only trade with the trend - that's what you want to do!

